

3.1 Scripting Introduction
In this QCAD tutorial, we learn how to use the script shell and the QCAD Simple API.
As an example, we plot a mathematical function.
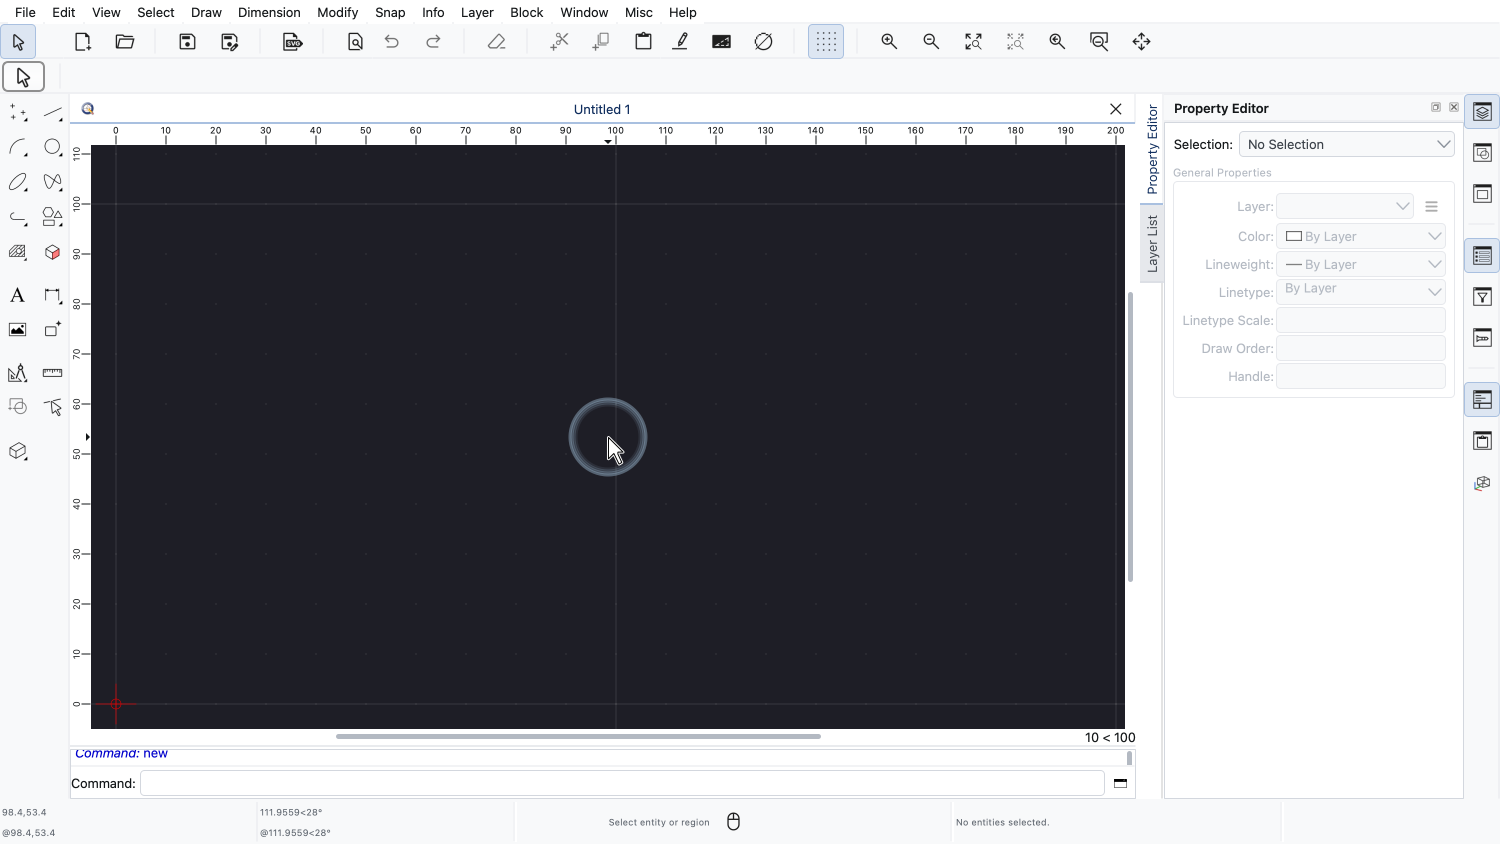
QCAD can be extended and automated with scripts written in JavaScript, also known as ECMAScript.
In fact, most of the tools in QCAD are implemented as scripts.
The easiest way to get started with scripting is the script shell, an interactive console inside QCAD.
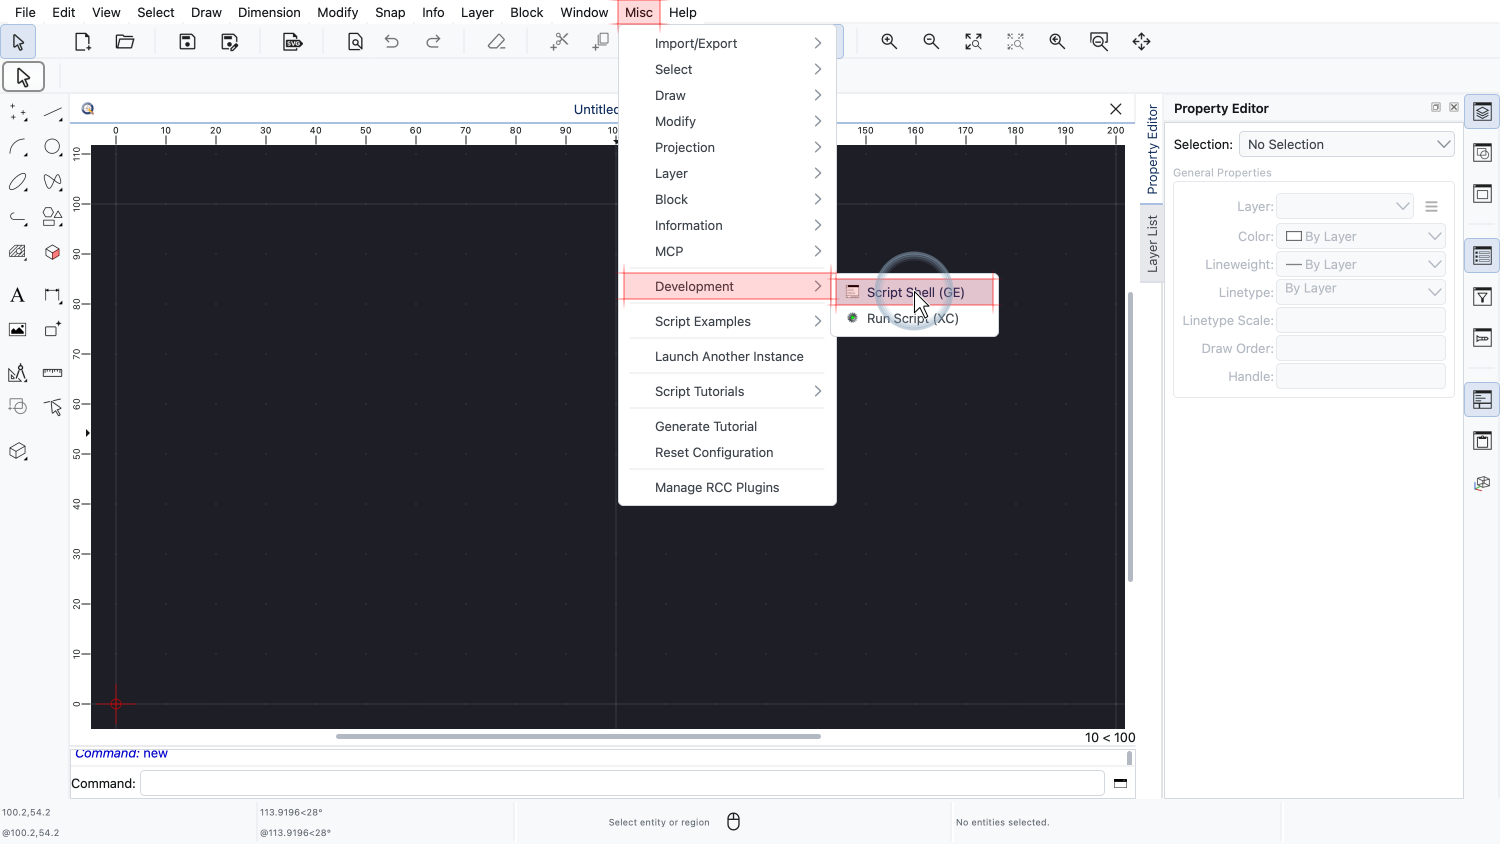
The script shell can be found in the Misc menu, in the submenu Development.
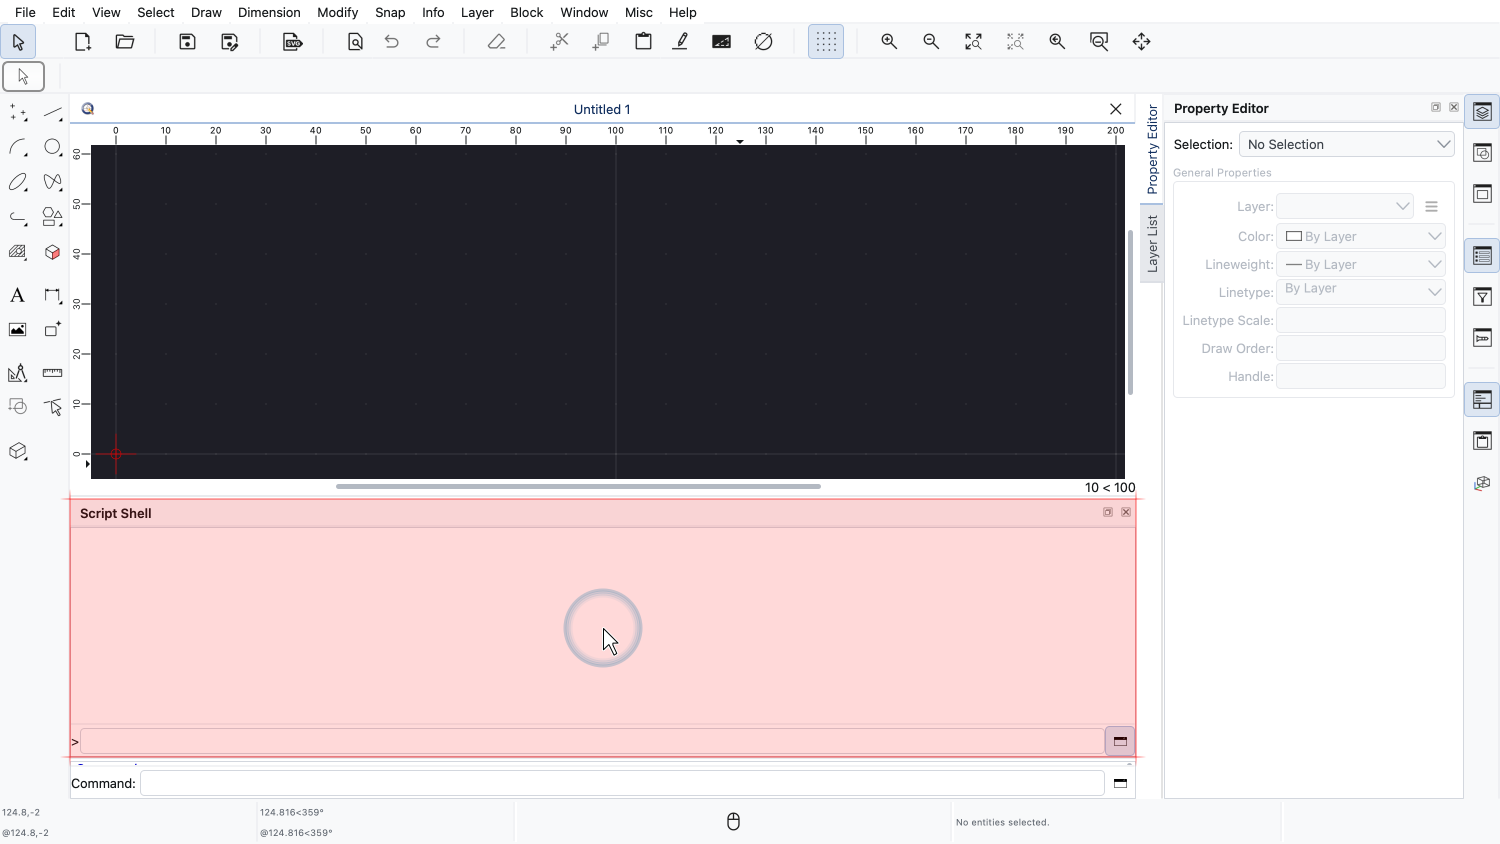
The script shell opens as a dock widget. We have moved it here to the bottom of the window, below the drawing area.
Like any other dock widget, it can be moved to another side of the window or detached from the main window.
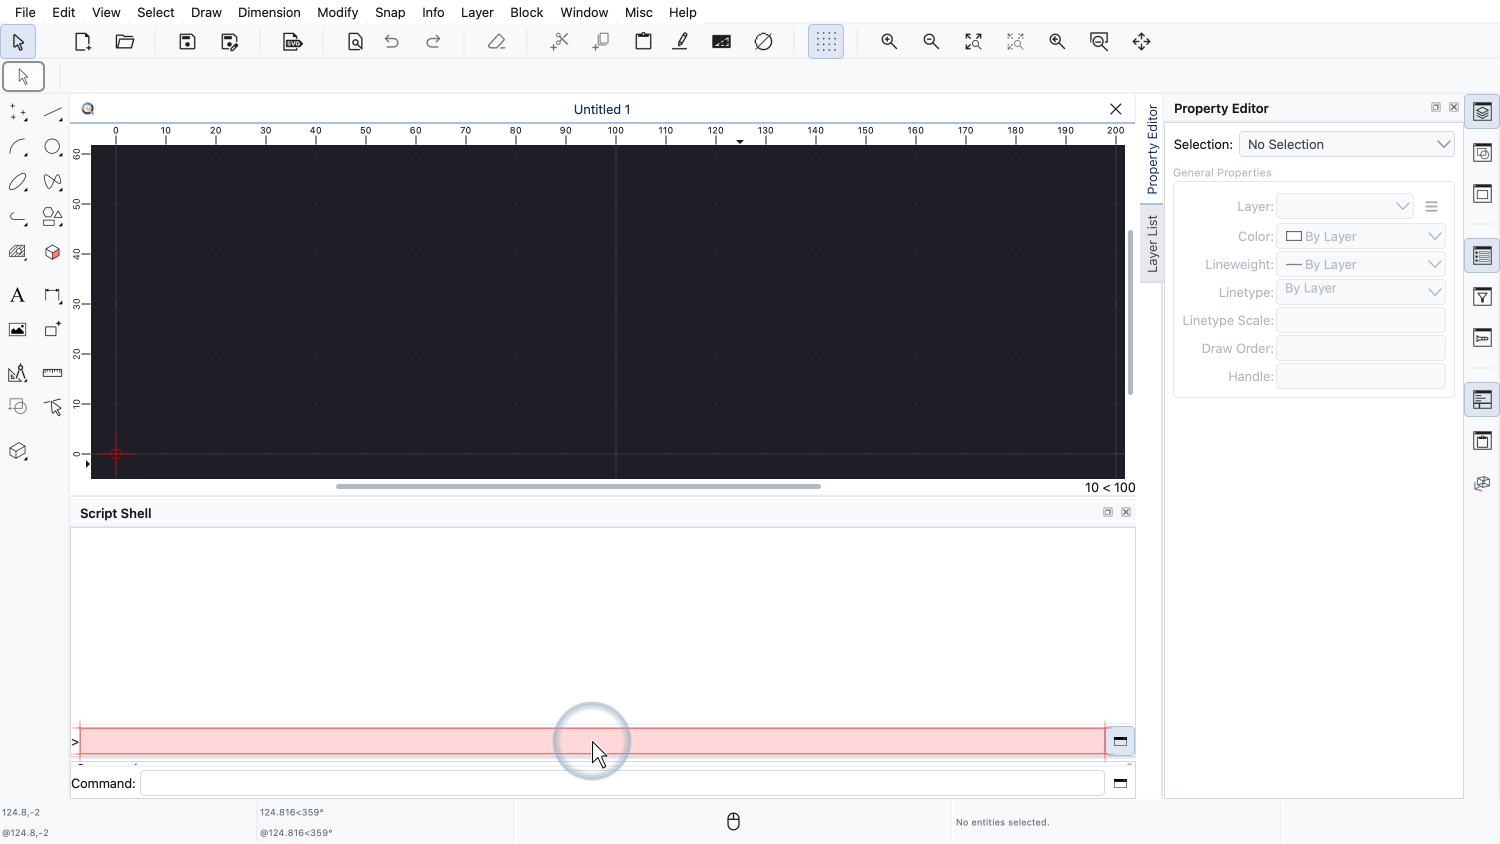
At the bottom of the script shell, we find the command line where we enter our JavaScript code.
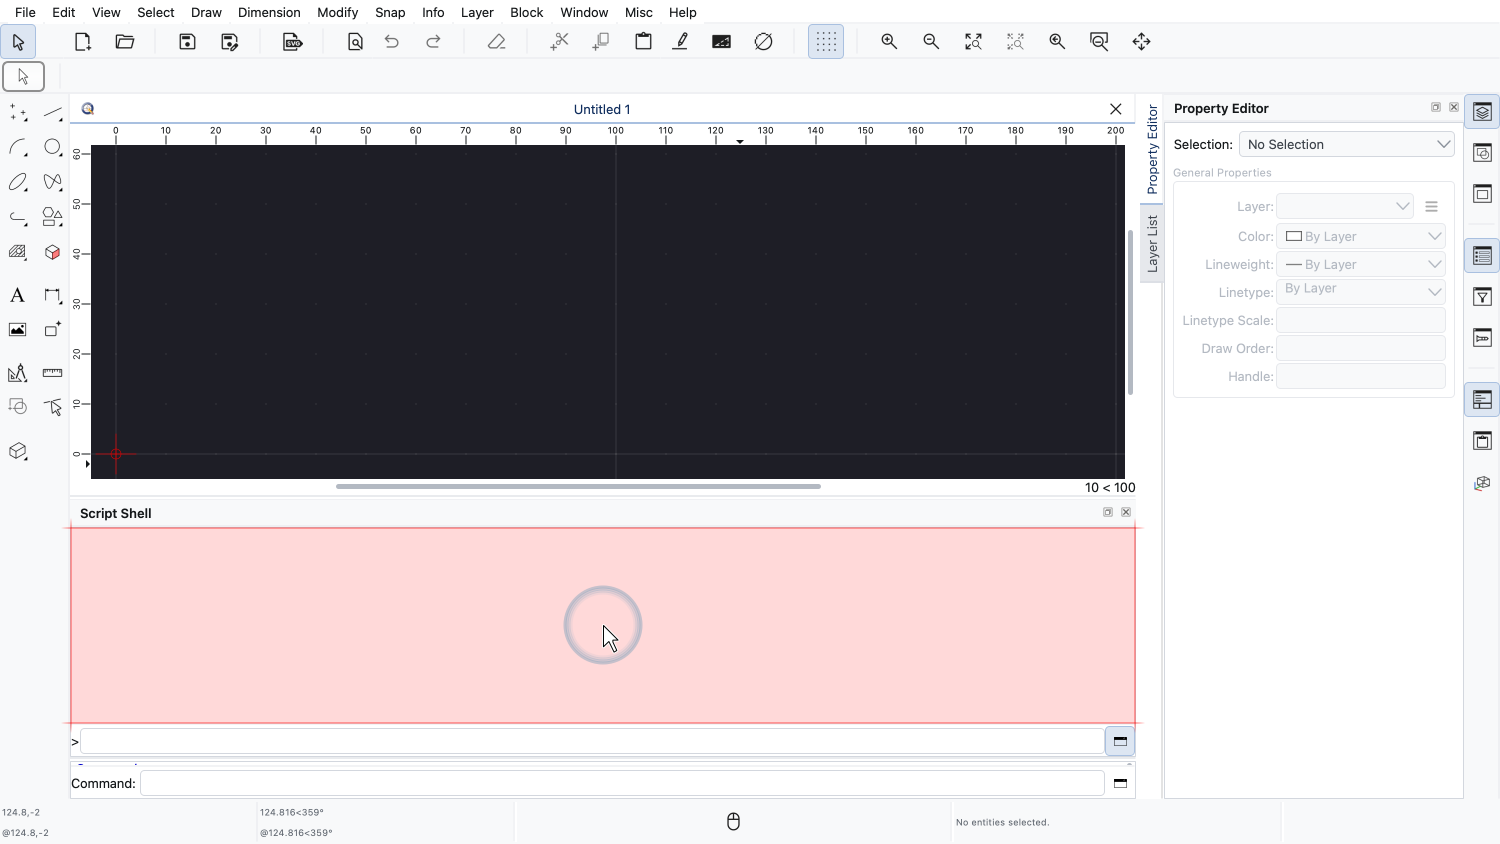
The area above the command line shows the history of our input and the output of the shell.
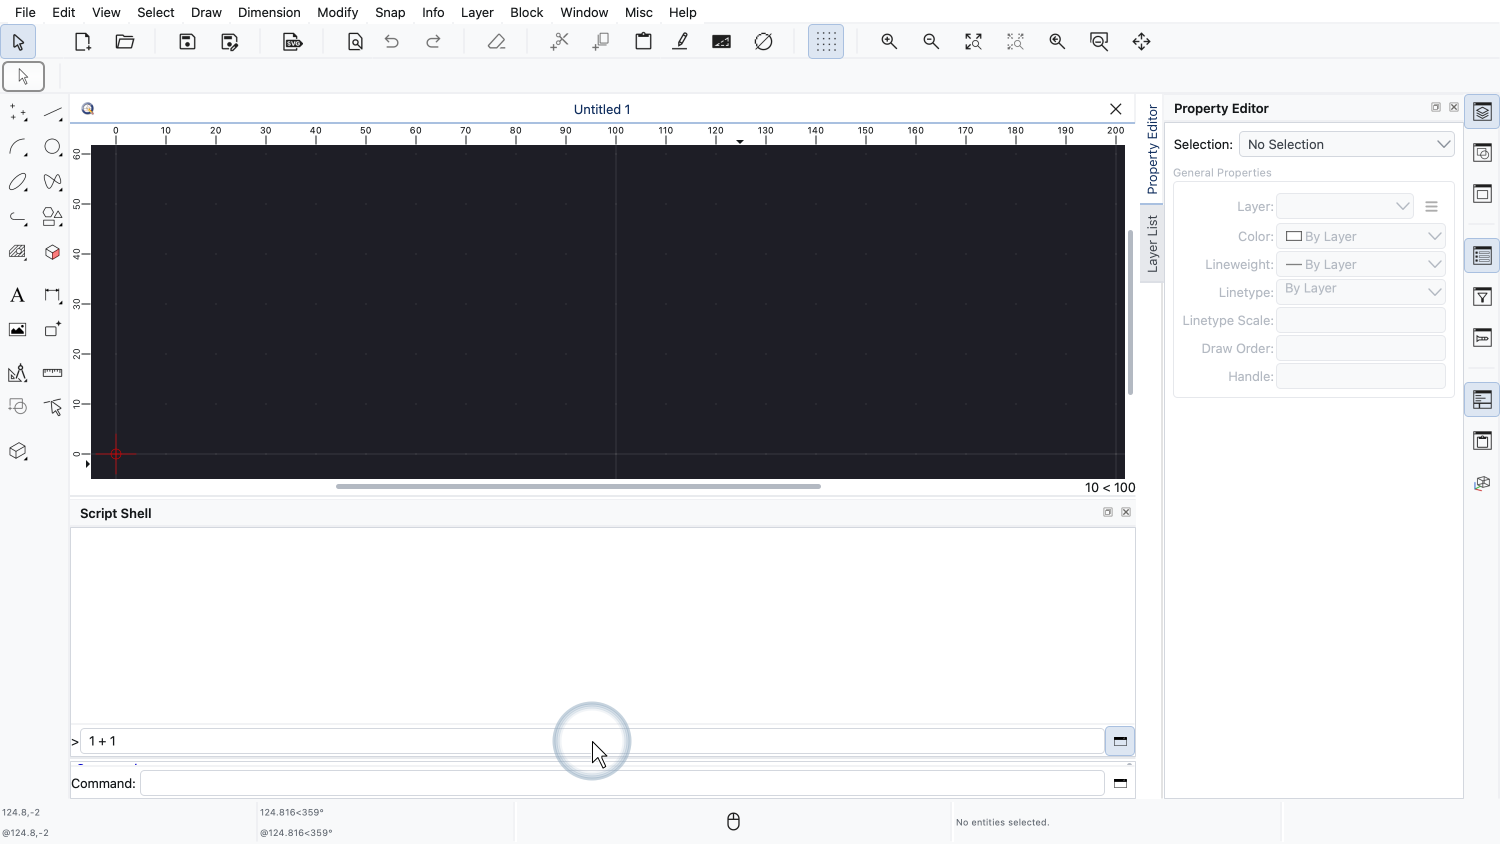
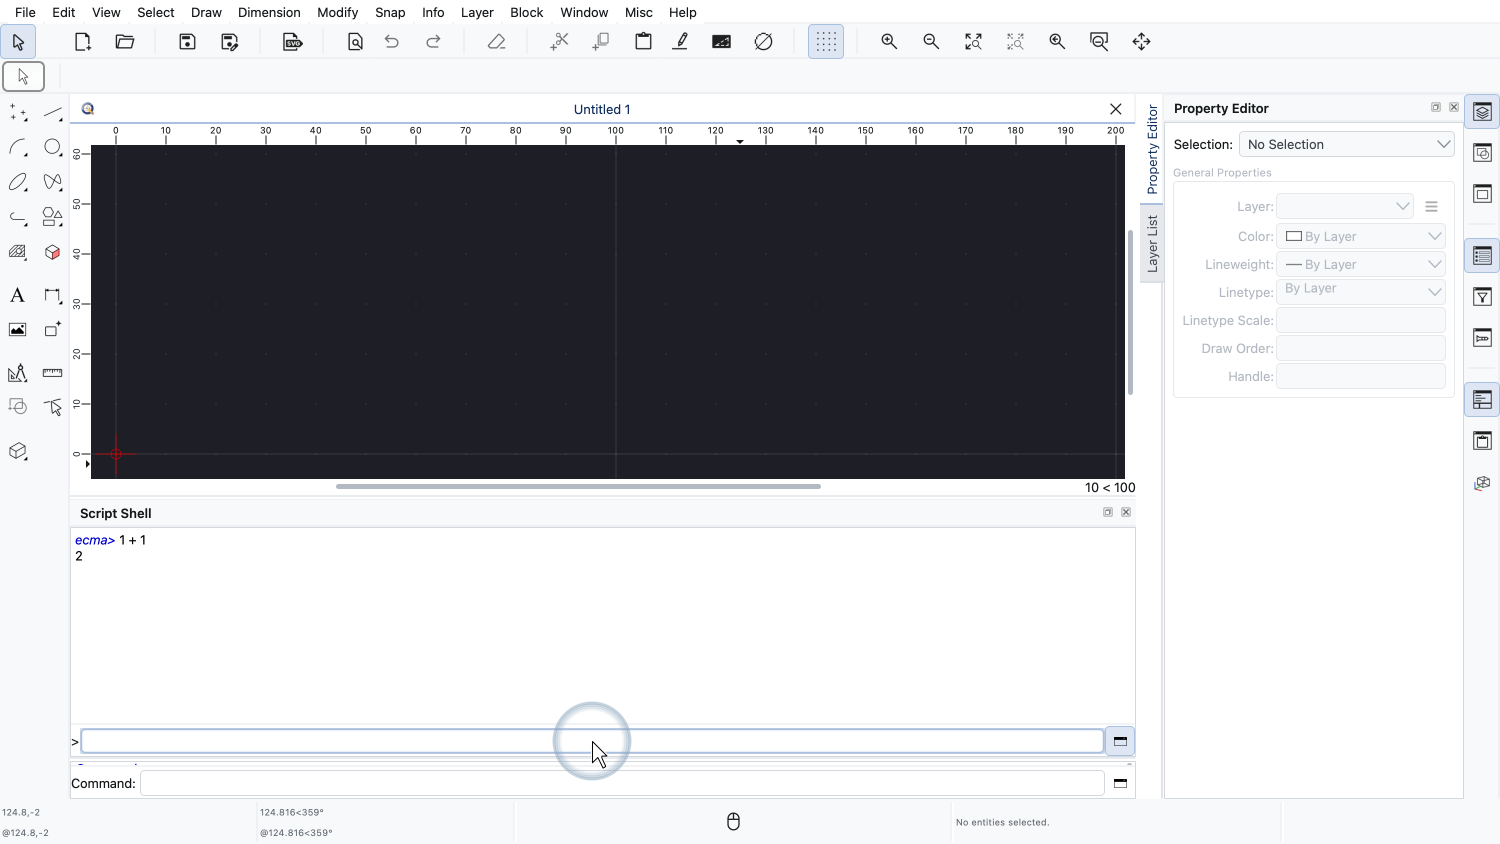
Let's try it out. We type a simple expression into the command line and press Enter.
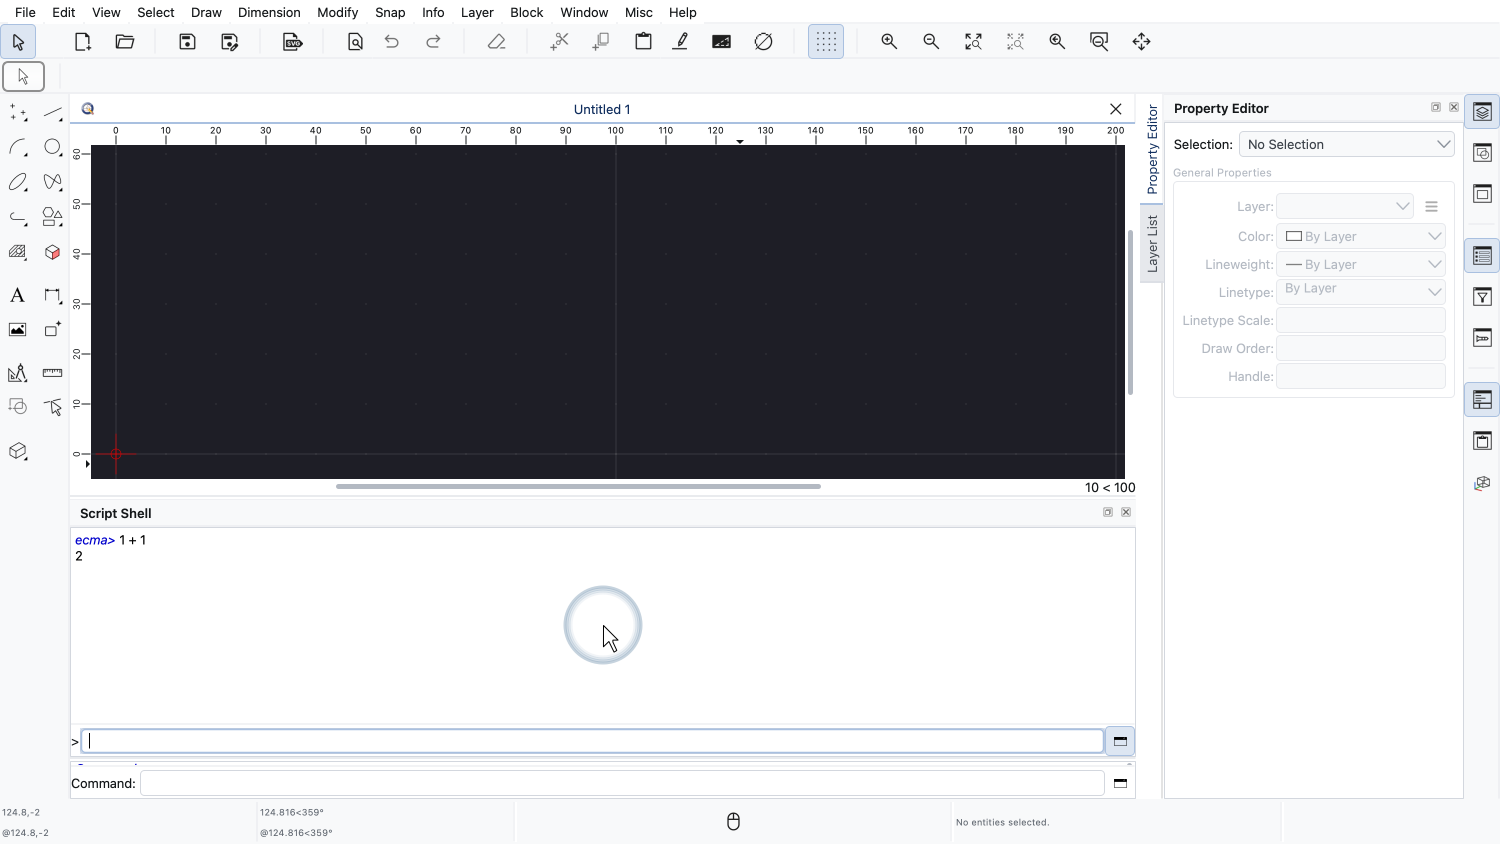
The shell evaluates the expression and prints the result.
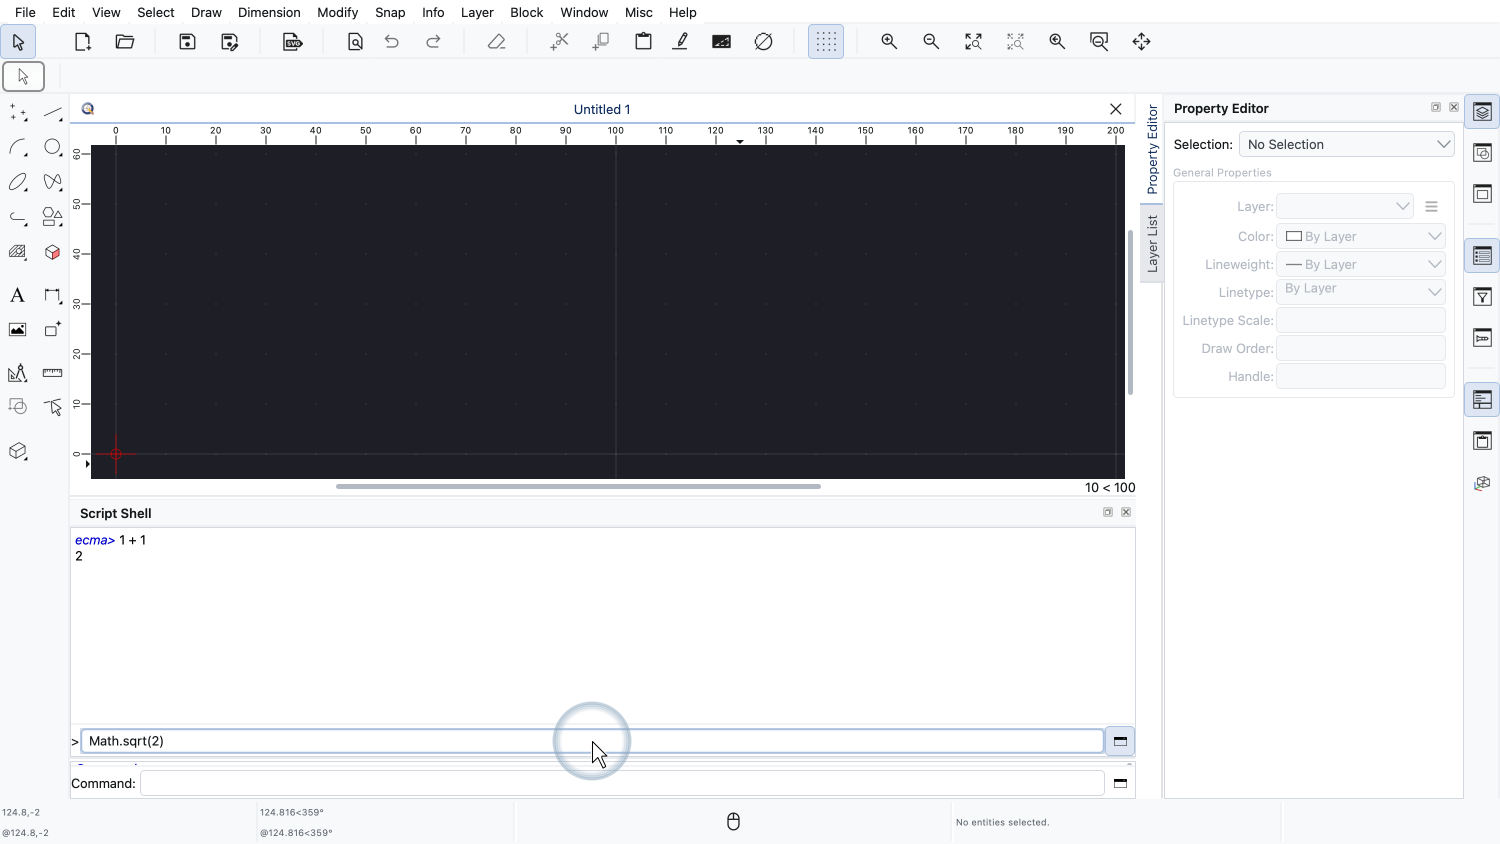
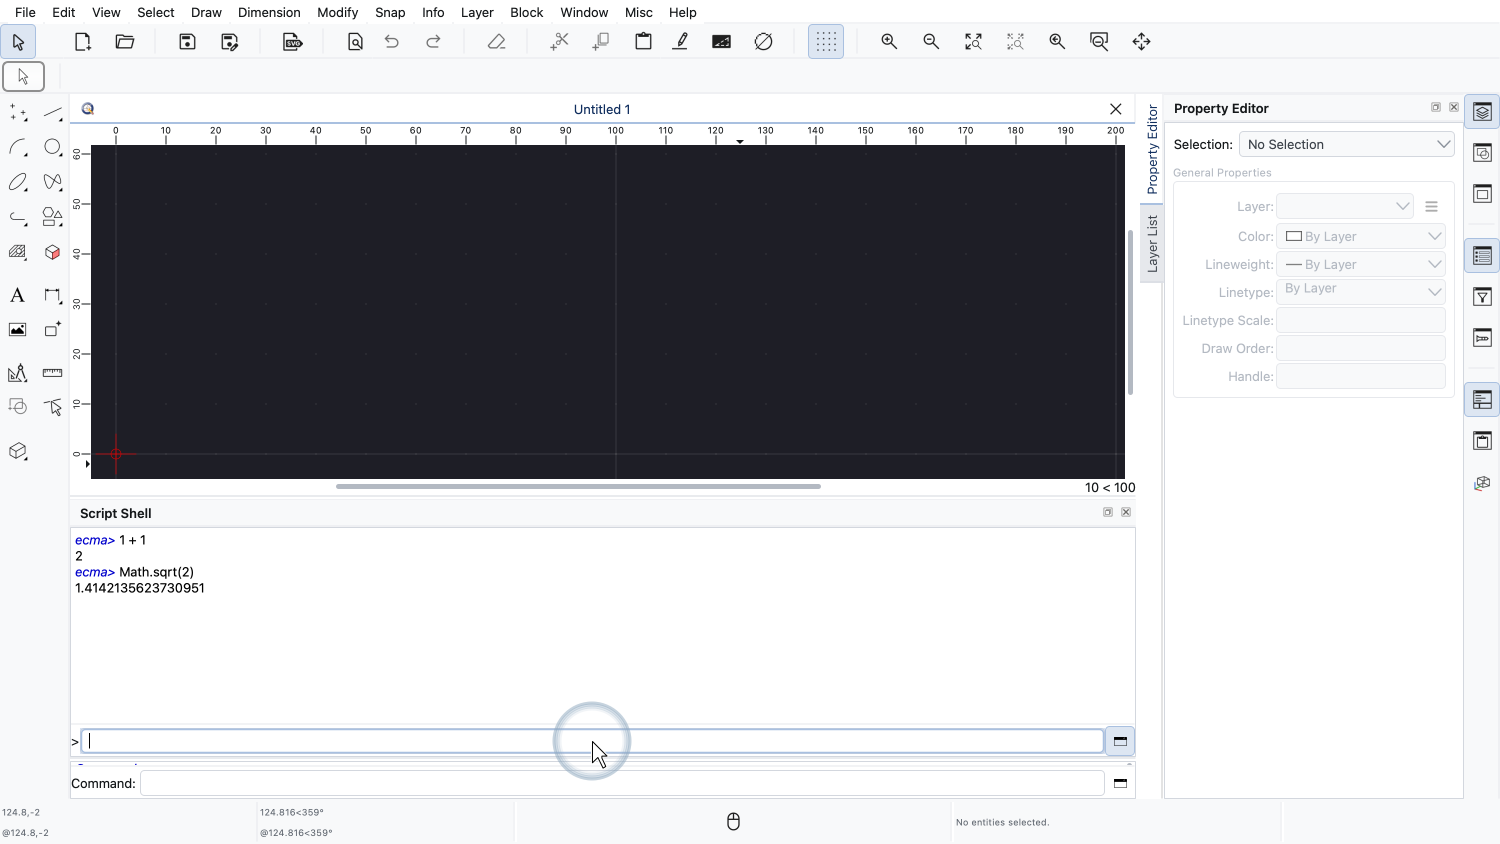
We can use everything JavaScript has to offer, for example the functions of the Math object.
In addition, the shell gives us access to the complete scripting interface of QCAD, including the current drawing.
The QCAD Simple API is a collection of functions that make it very easy to work with a drawing from the script shell.
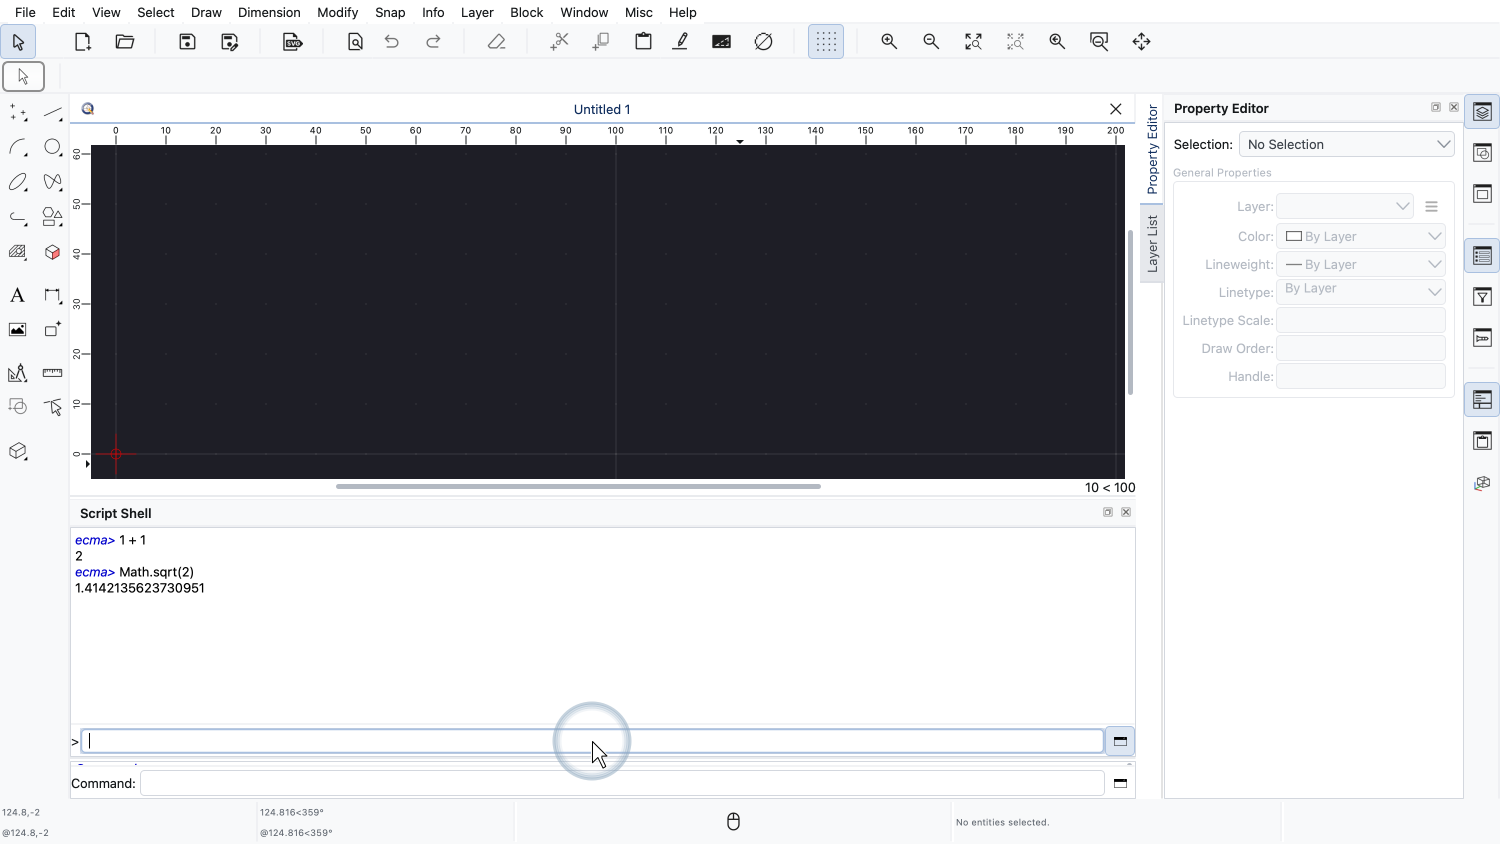
For example, the function addLine adds a line to the current drawing.
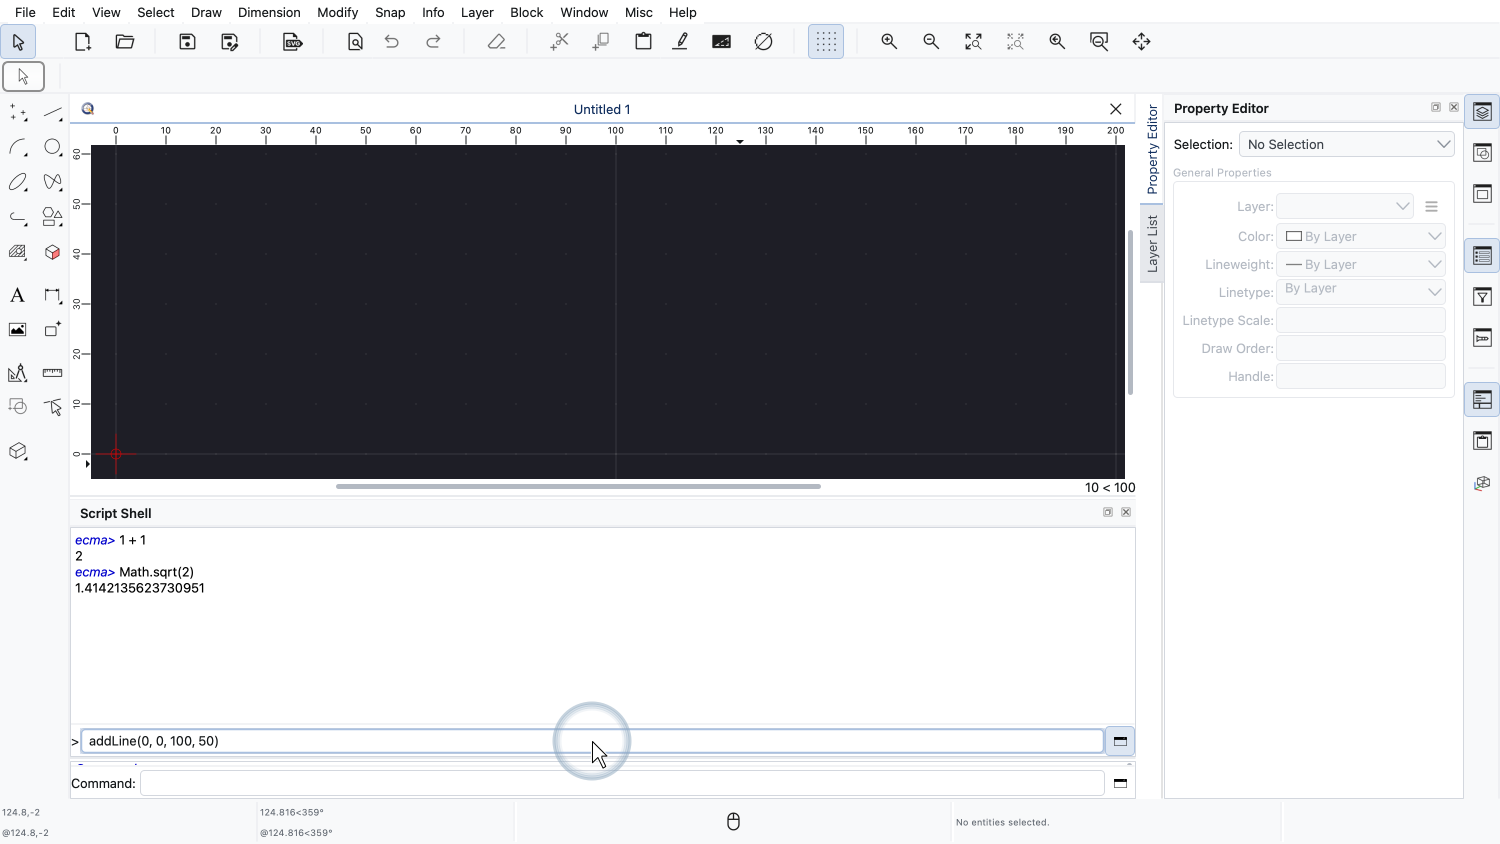
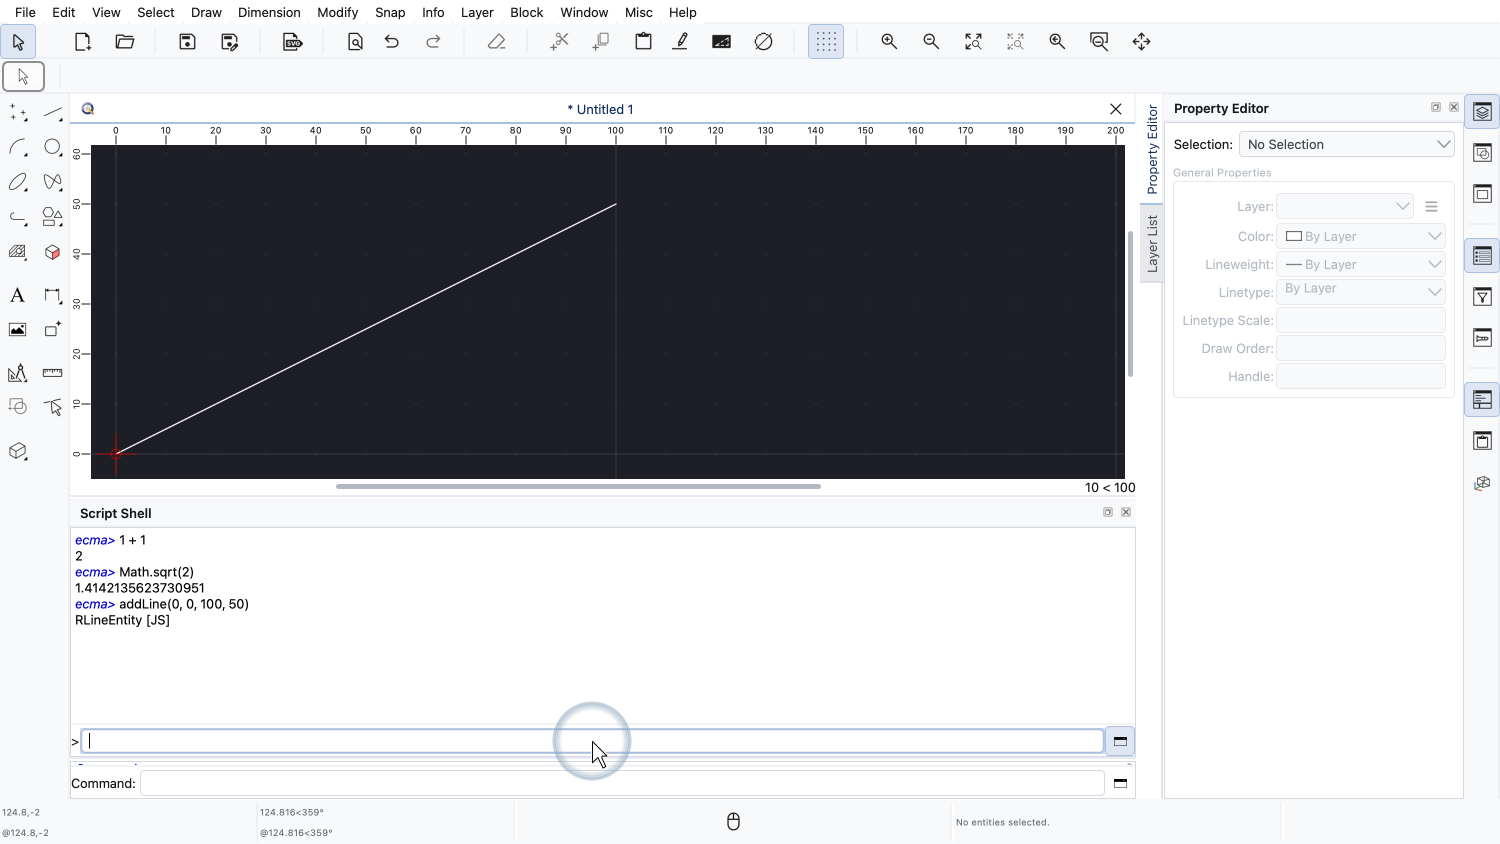
We pass the X and Y coordinates of the start point and the end point of the line as arguments.
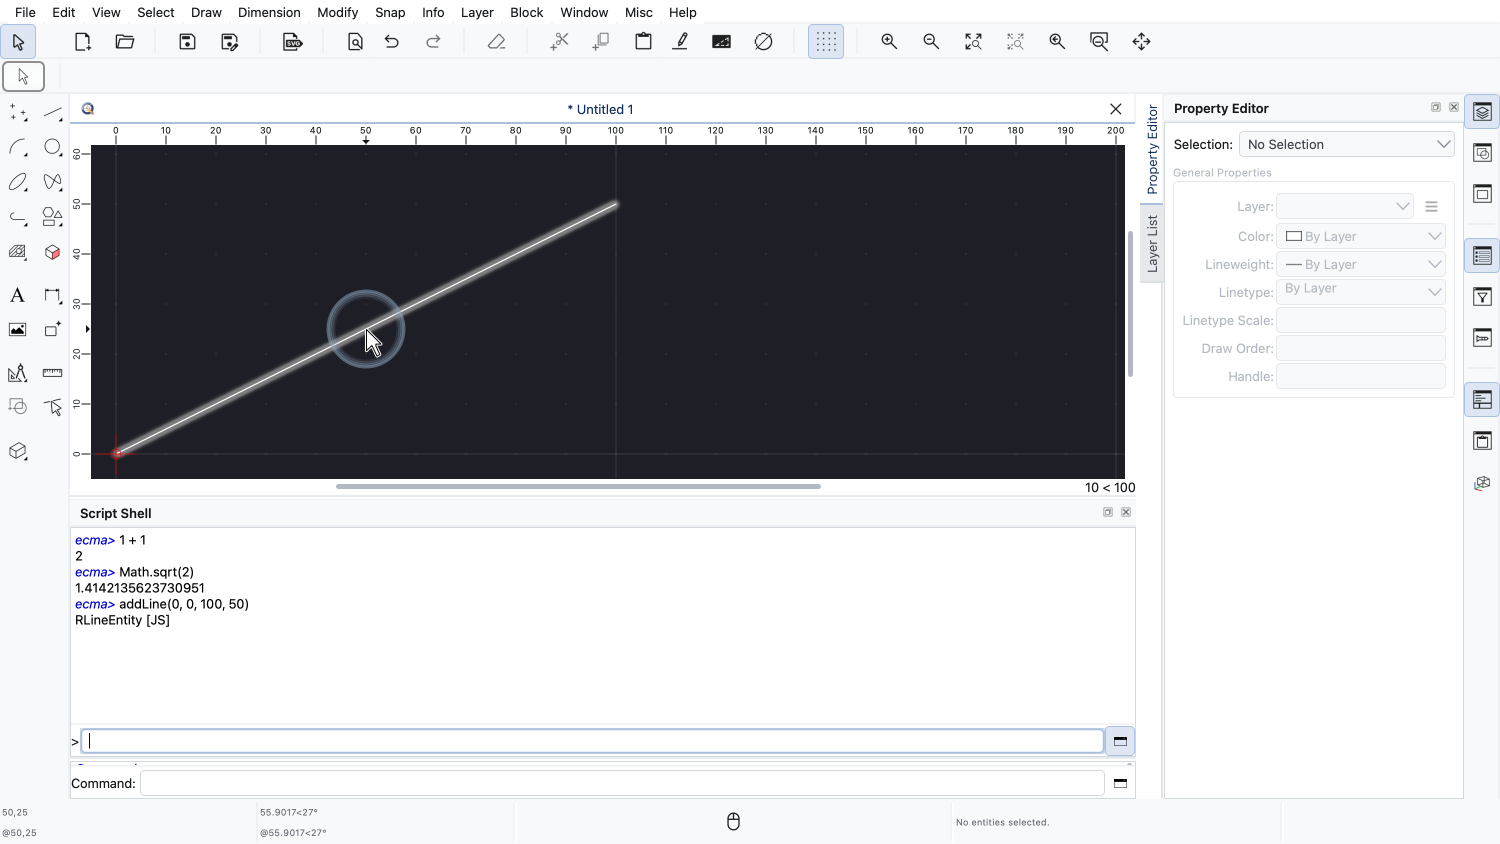
The line is added to the drawing immediately.
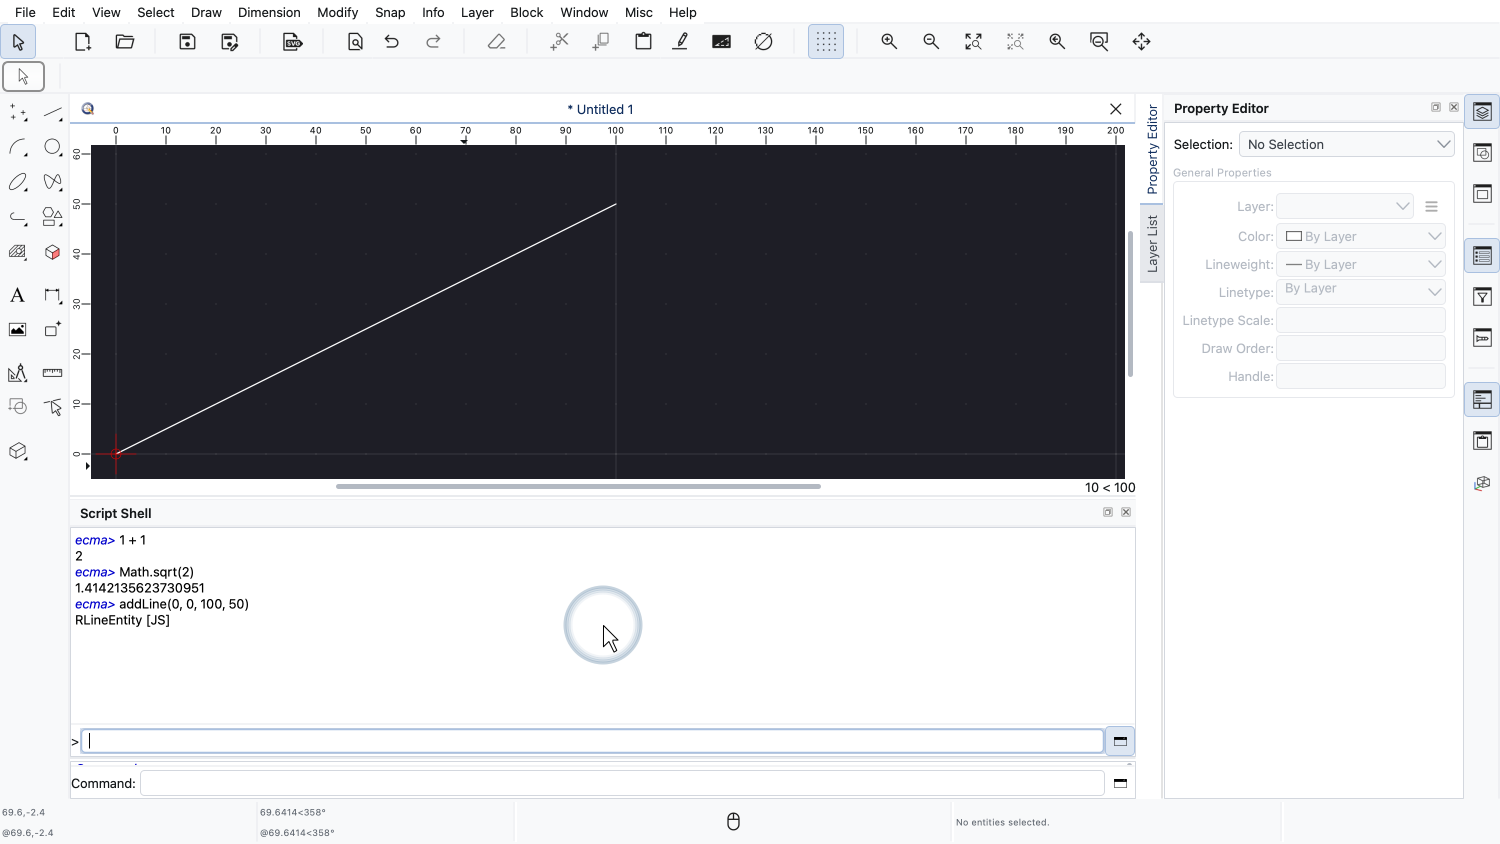
The shell prints the entity that was created as the result of the function call.
The script shell can also complete the names of functions for us.
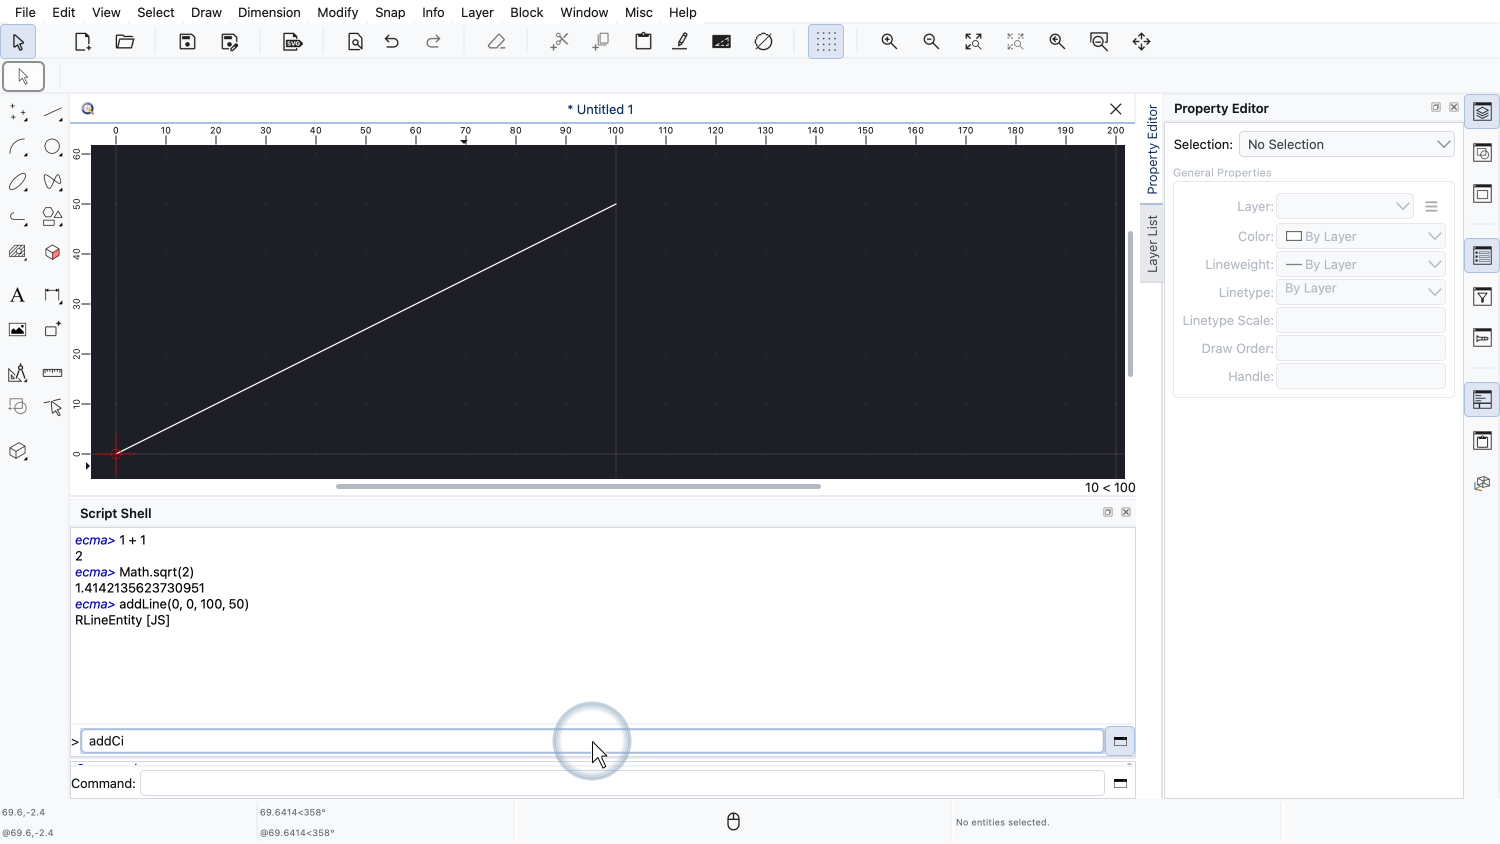
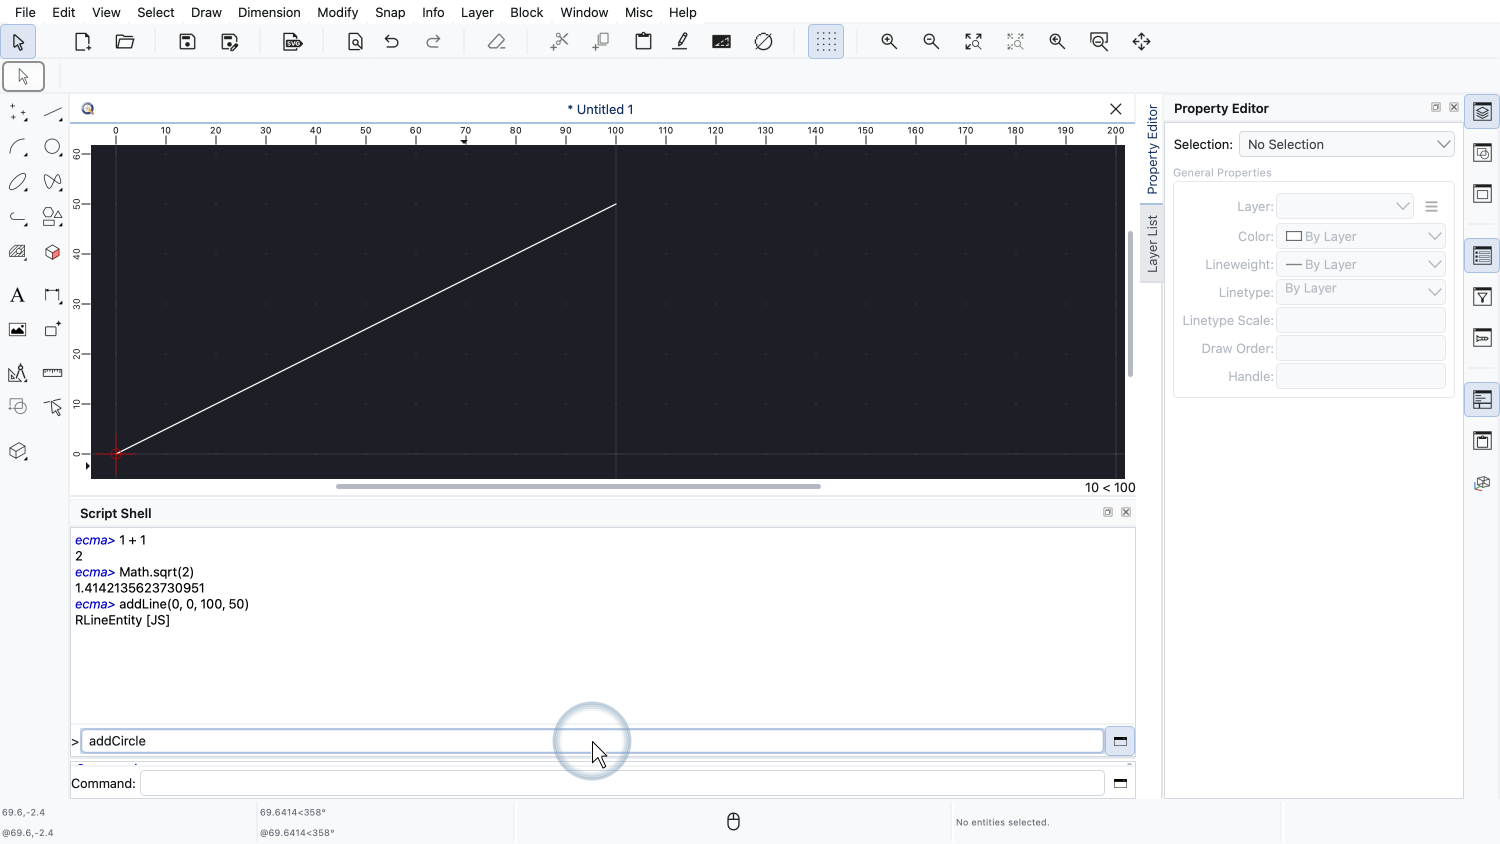
We type the first letters of the function addCircle and press the Tab key.
The function name is completed. If there are several possible completions, the shell lists them in the history.
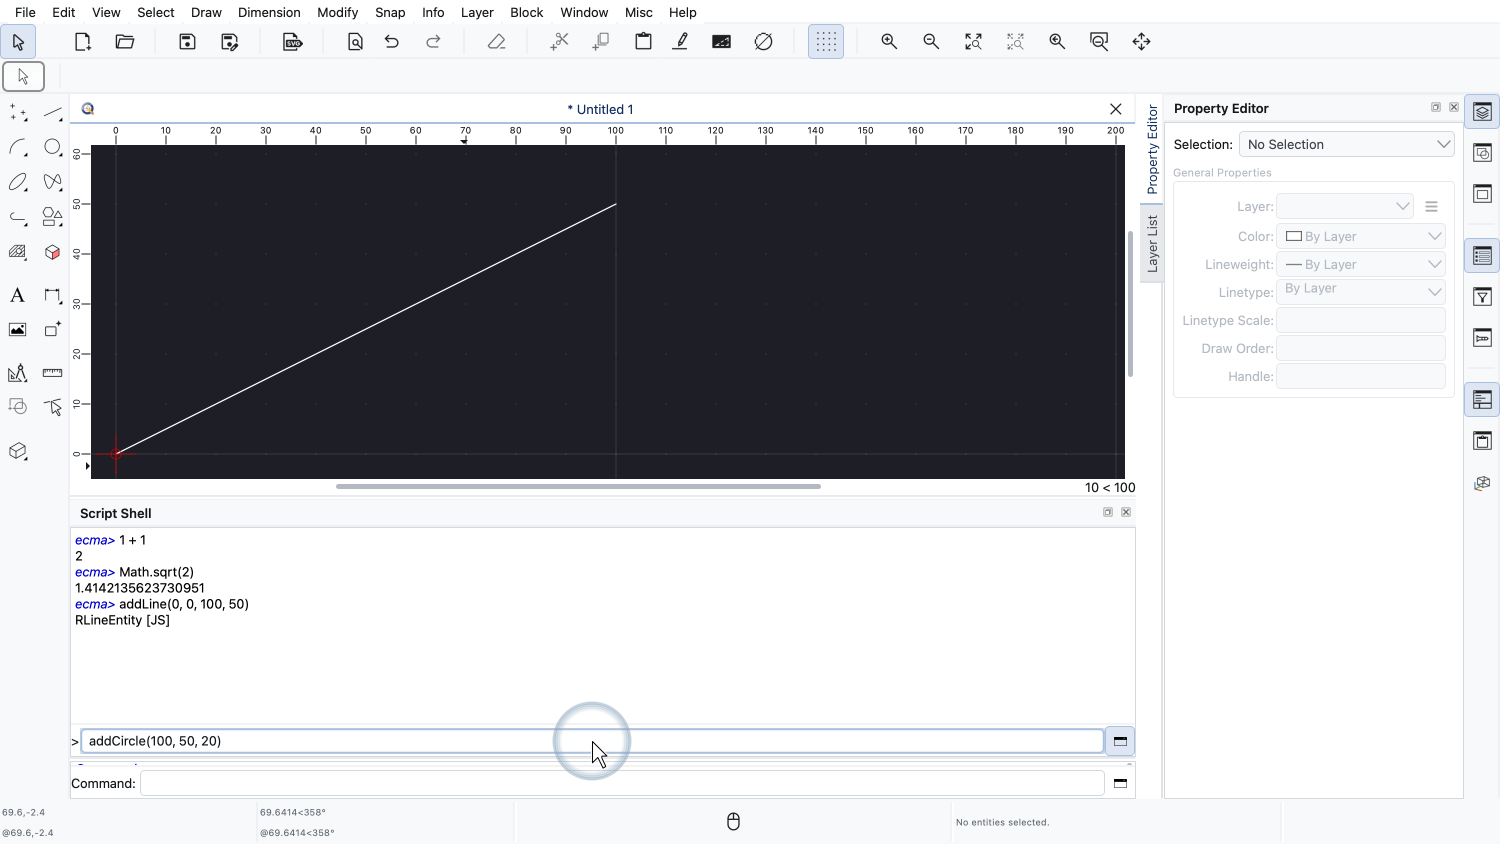

We add a circle with its center at the end point of the line and a radius of 20.
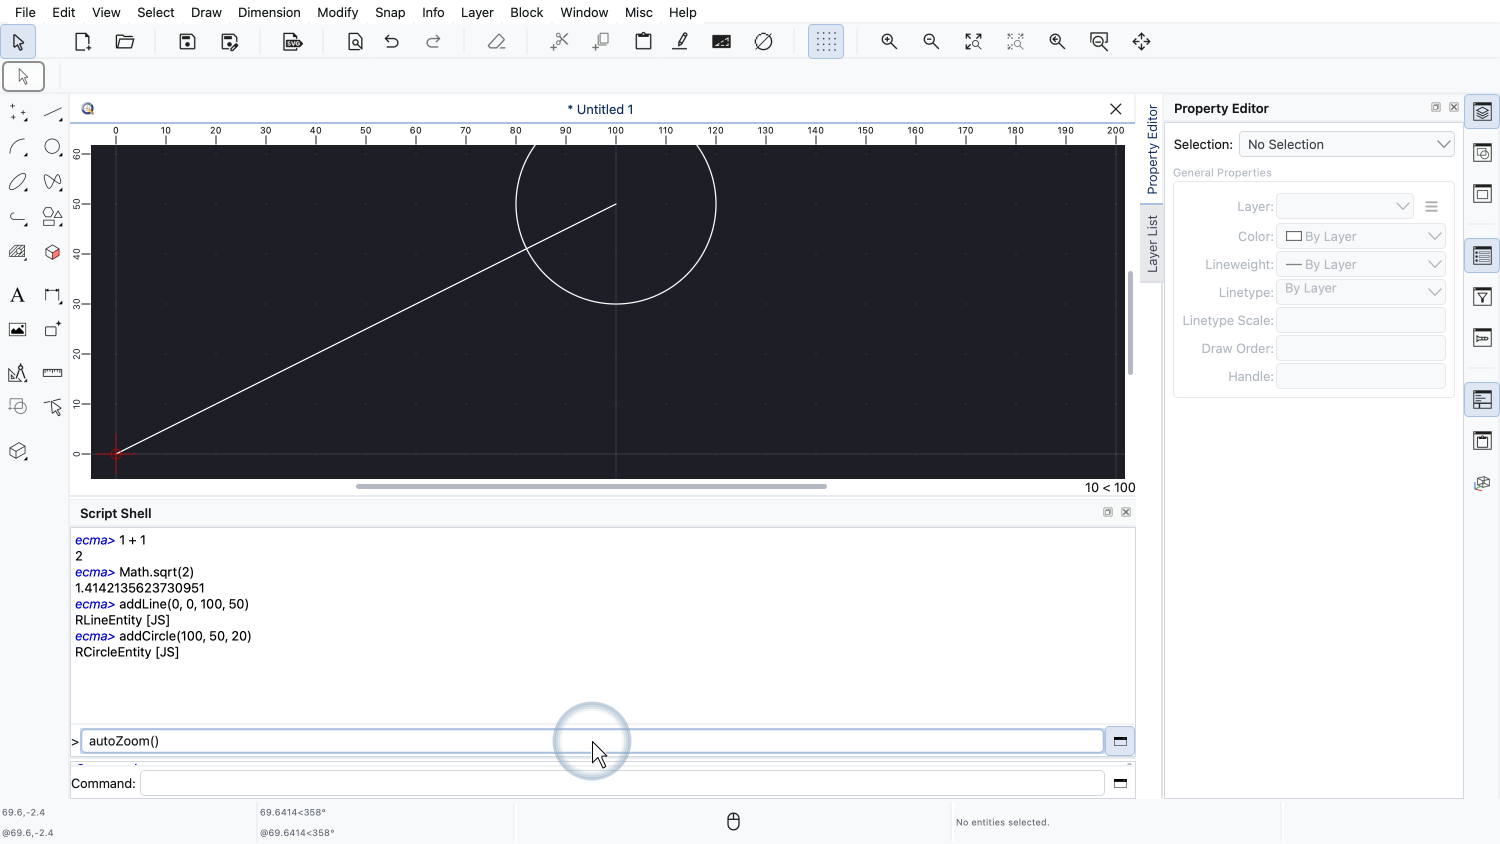
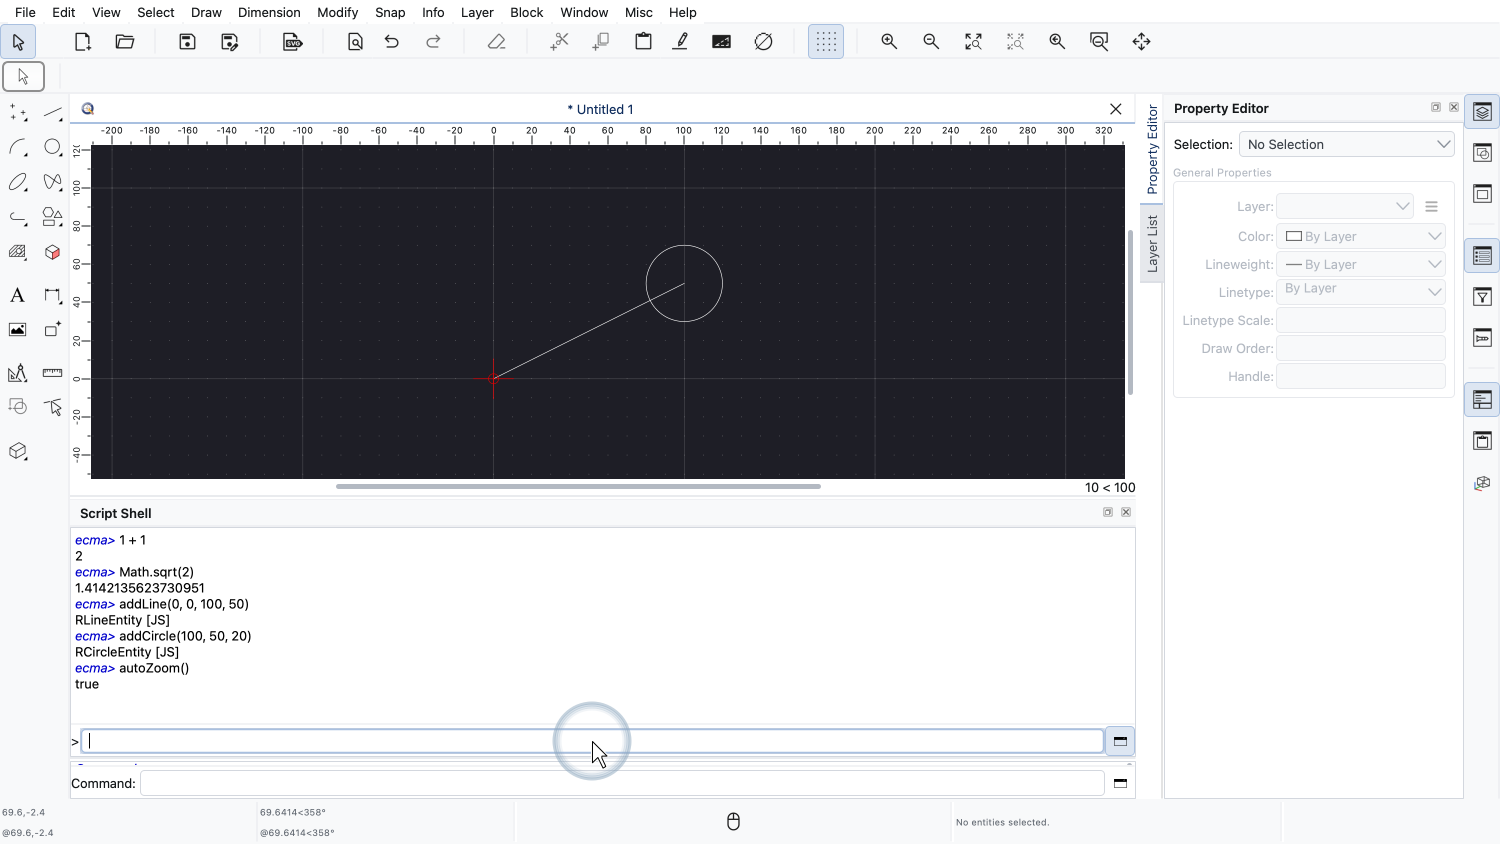
The function autoZoom shows the whole drawing in the drawing area, just like the zoom tool Auto Zoom.
Everything we add through the script shell is part of the normal undo history of the drawing.
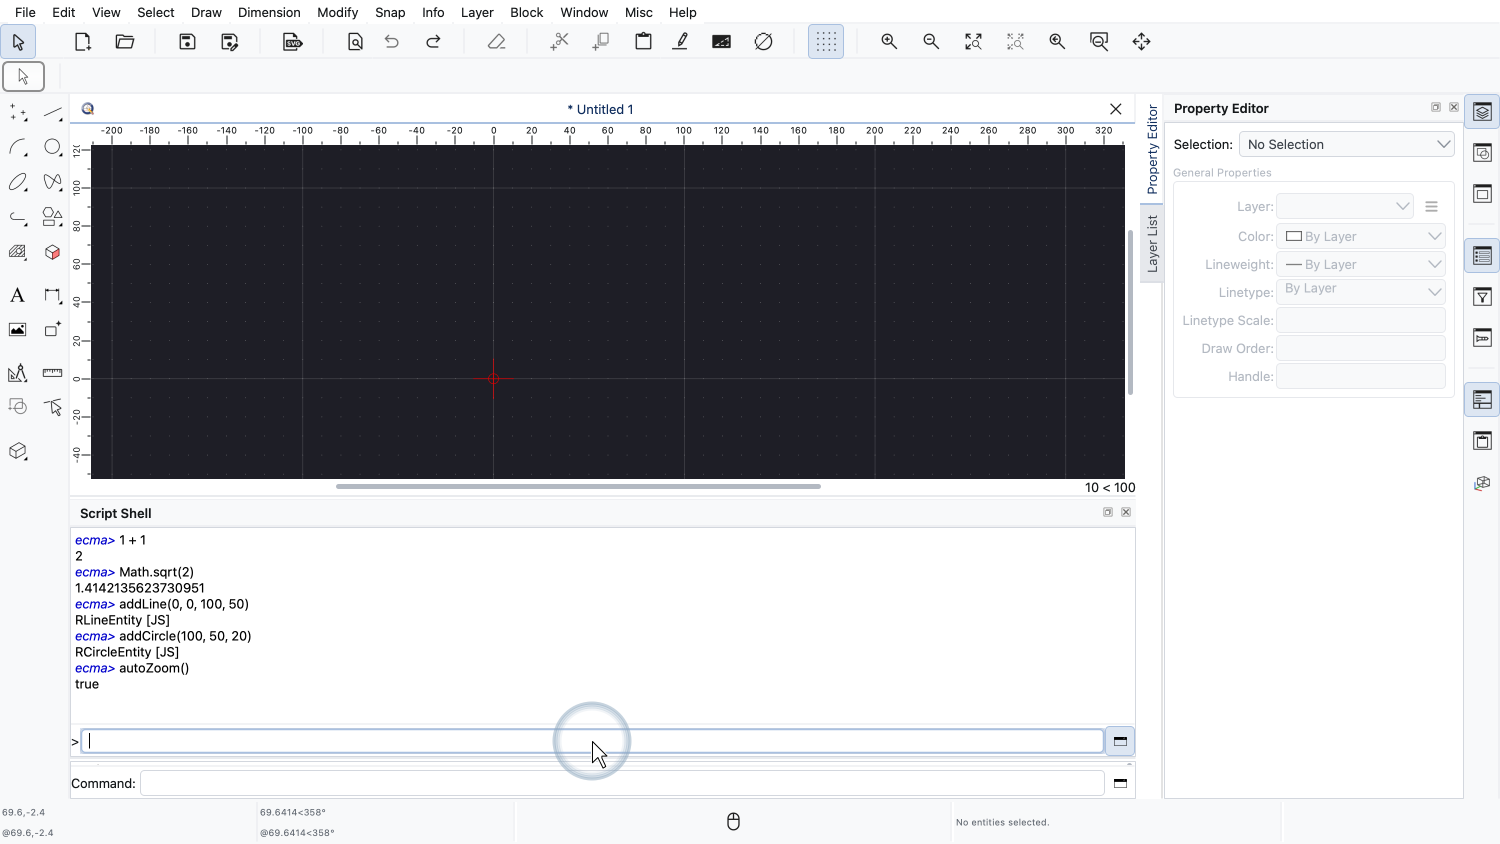
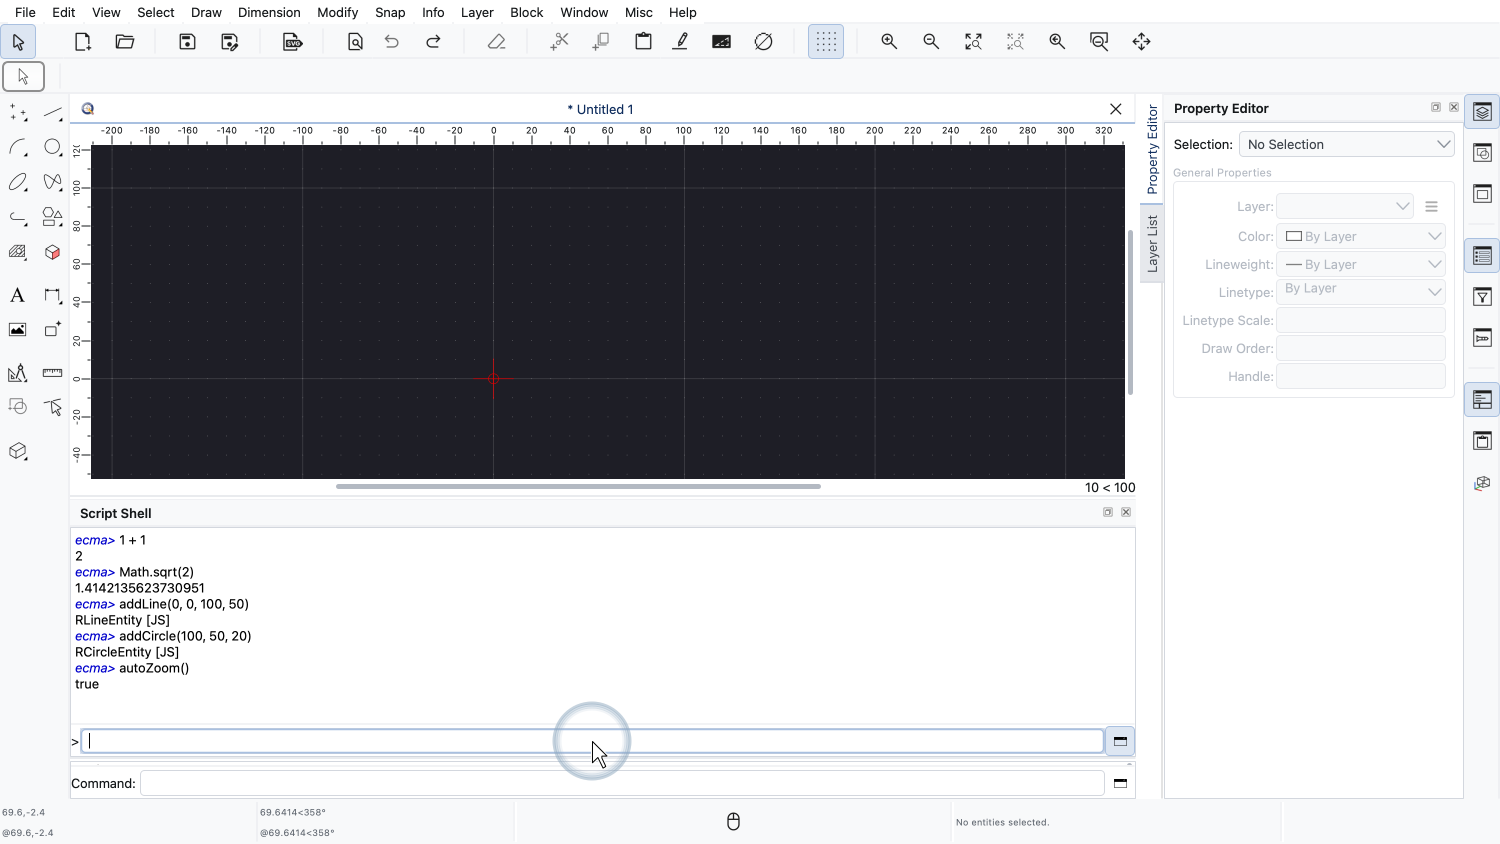
We undo our two additions to get an empty drawing again.
The Simple API offers many more functions, for example to add arcs, polylines, texts or layers, to move, rotate or trim entities and to query information about a drawing.
All of them are documented in the QCAD reference documentation.
Let's put this to use and plot a mathematical function.
First, we define the function we want to plot as a JavaScript function called f.
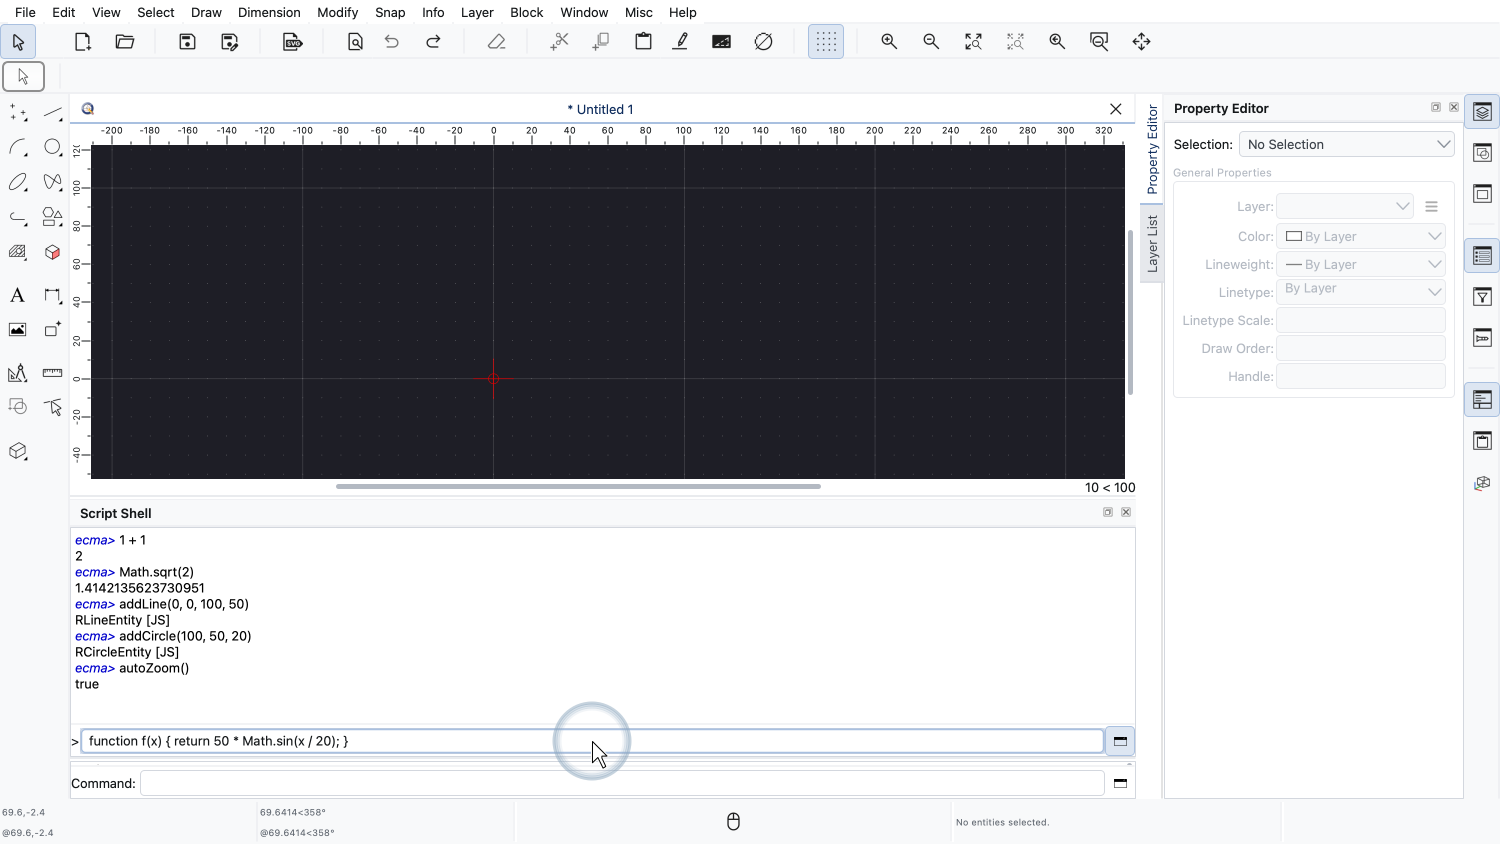
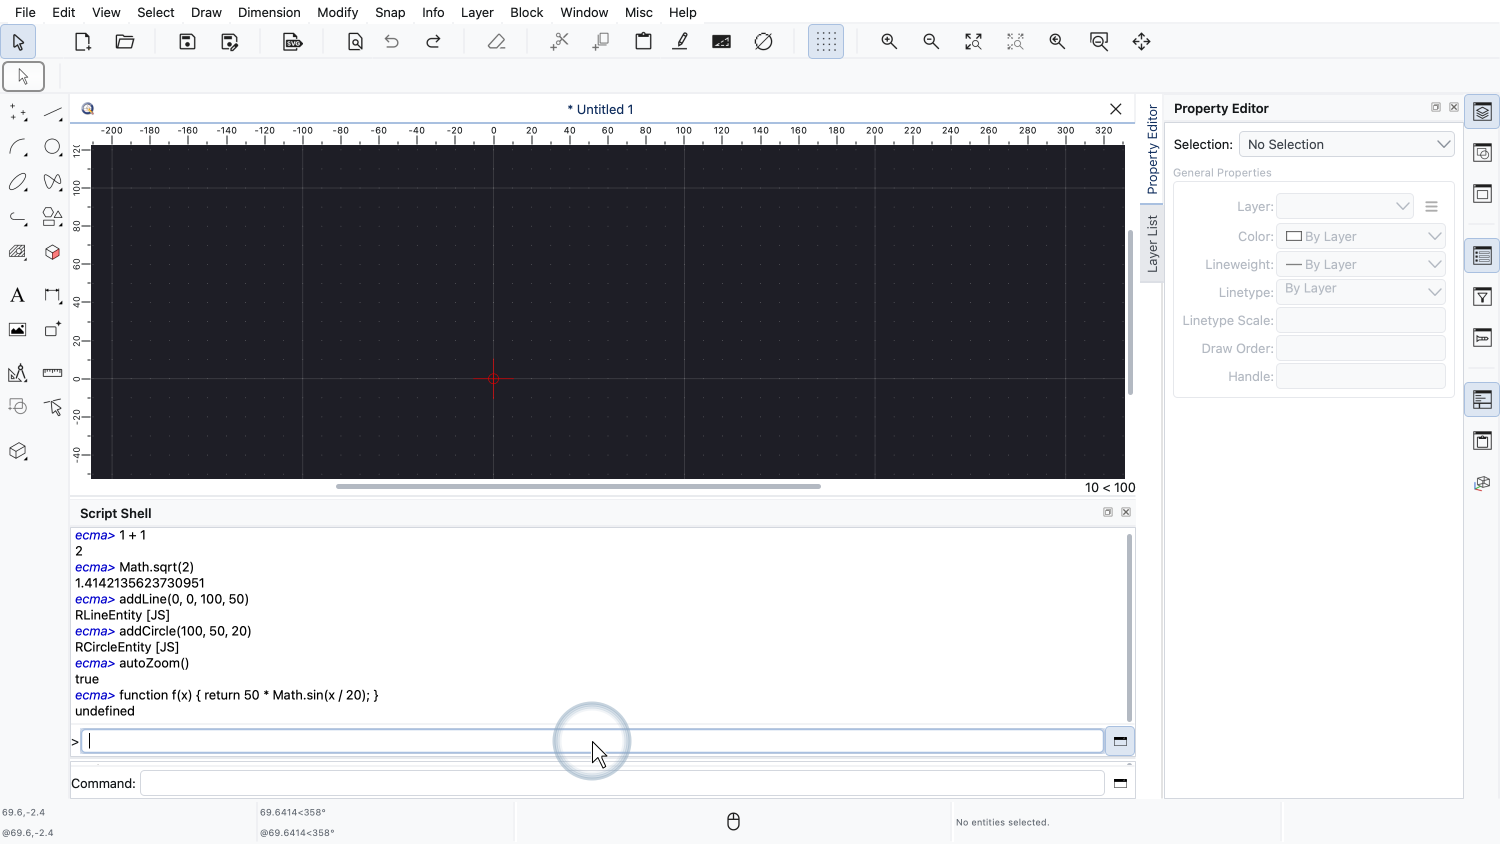
f of x returns 50 times the sine of x divided by 20.
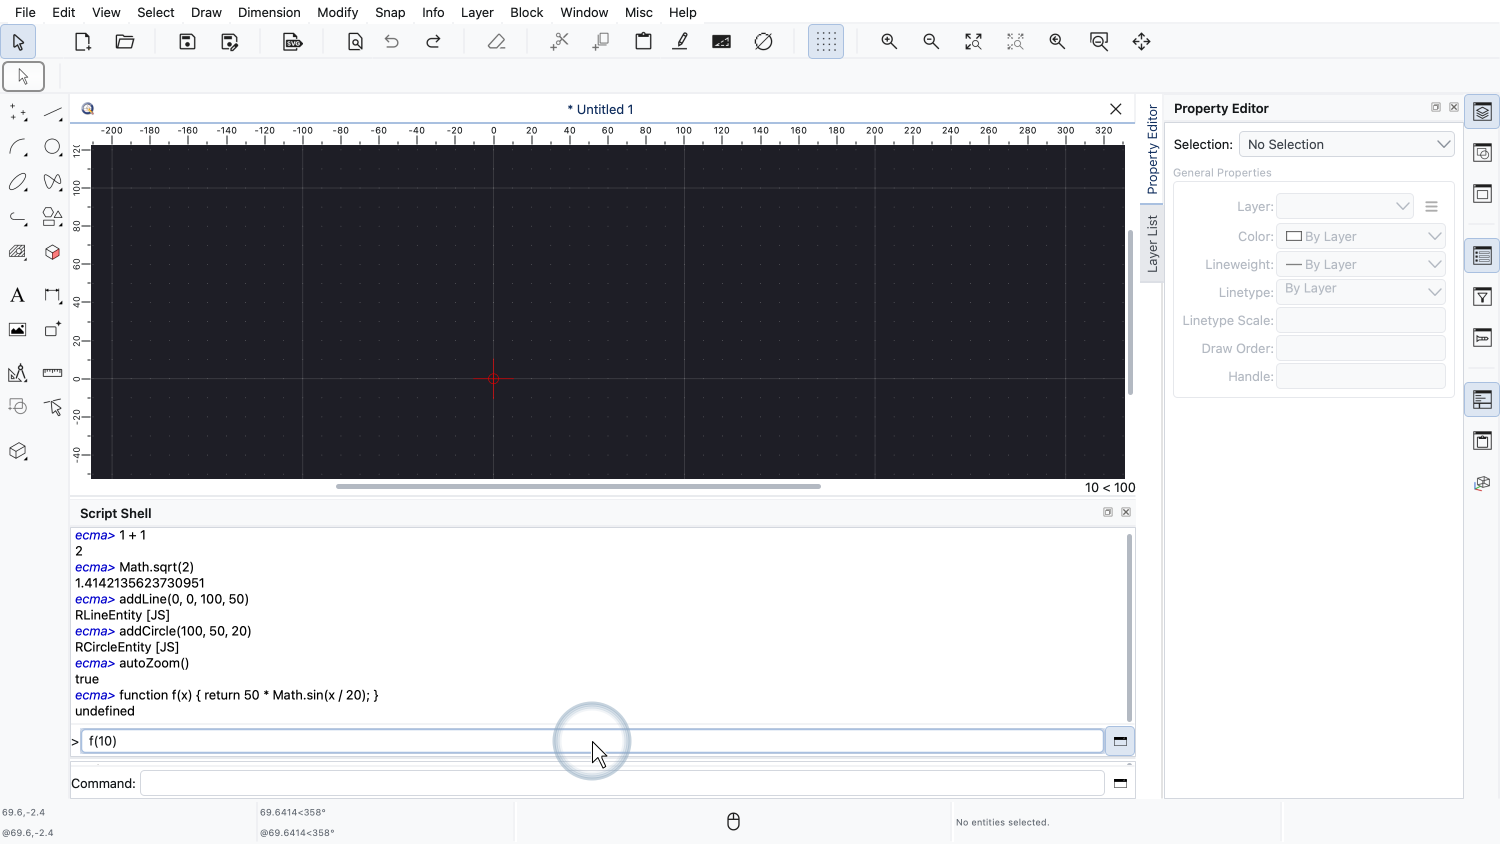

The function is now defined and we can call it, for example with an x value of 10.
To plot the function, we go through the x values from 0 to 200 in steps of 10 and connect the function values with lines.
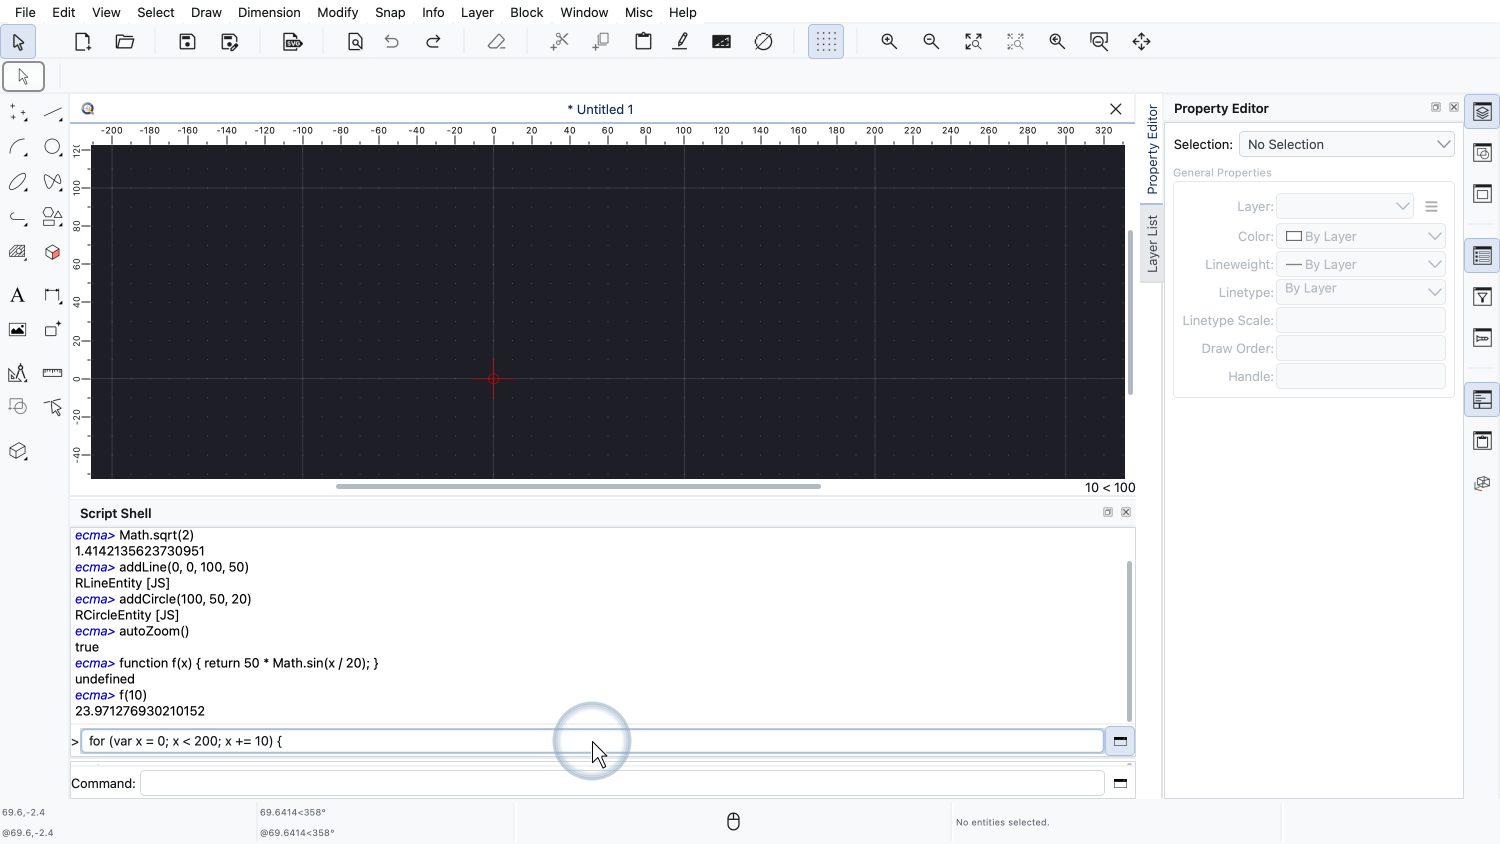
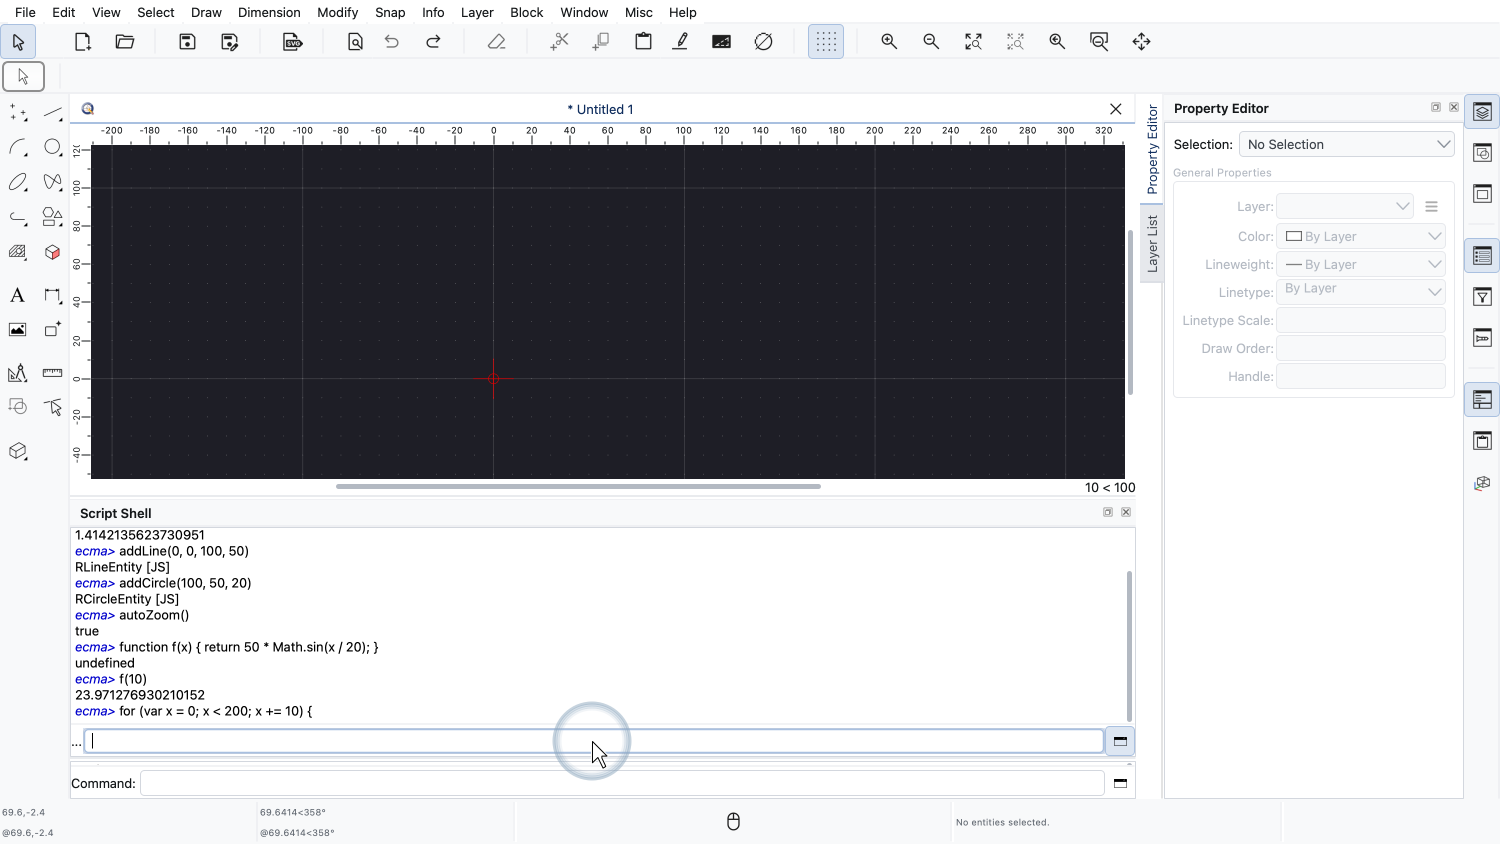
We do this with a for loop. The loop starts with x equals 0 and increases x by 10 as long as x is less than 200.
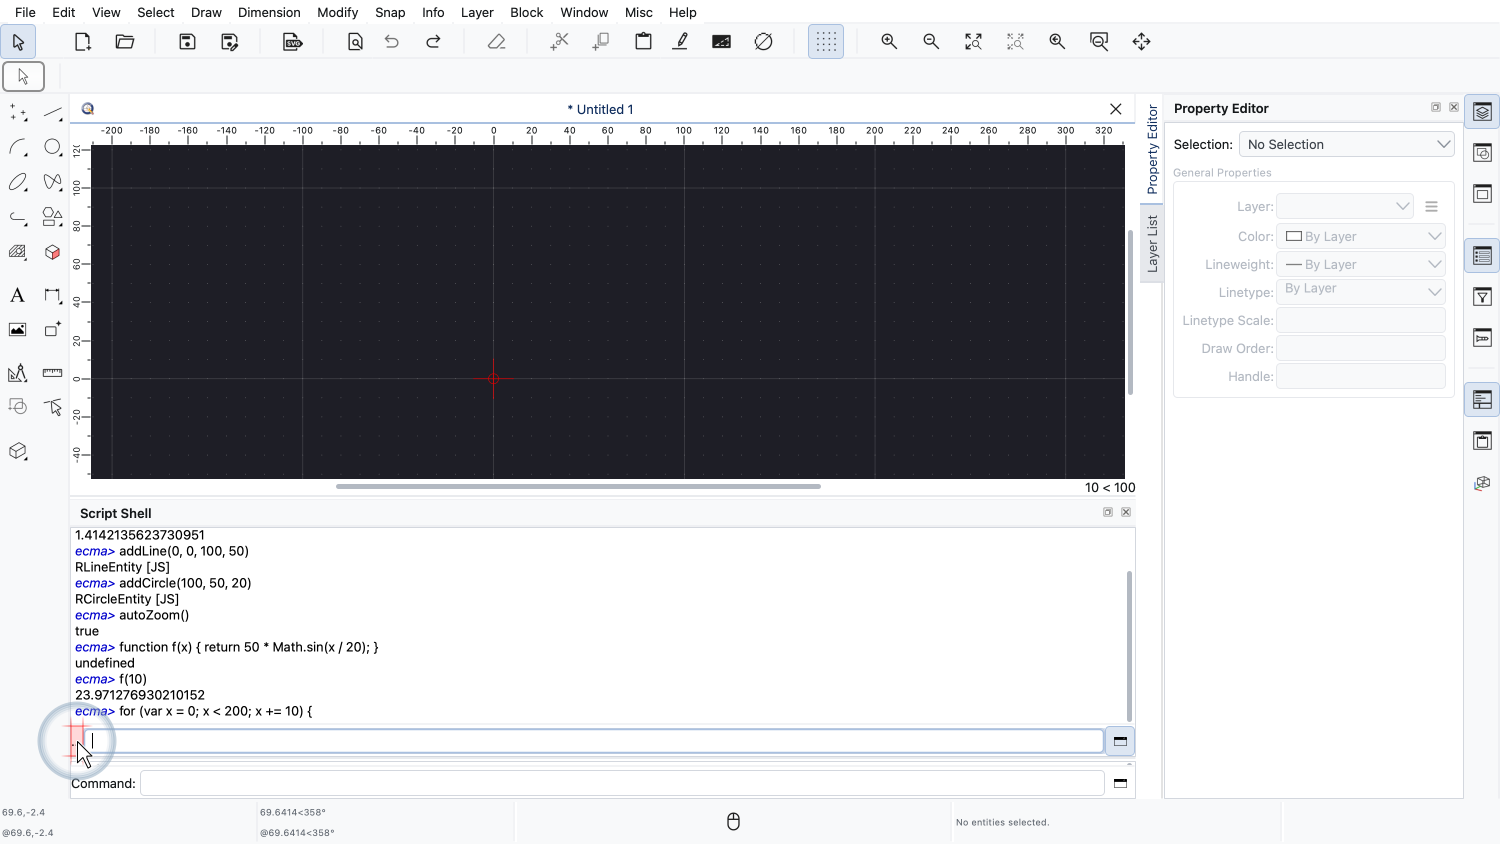
The opening brace is still open, so the shell waits for more input before it runs our code. The prompt changes to three dots to indicate this.
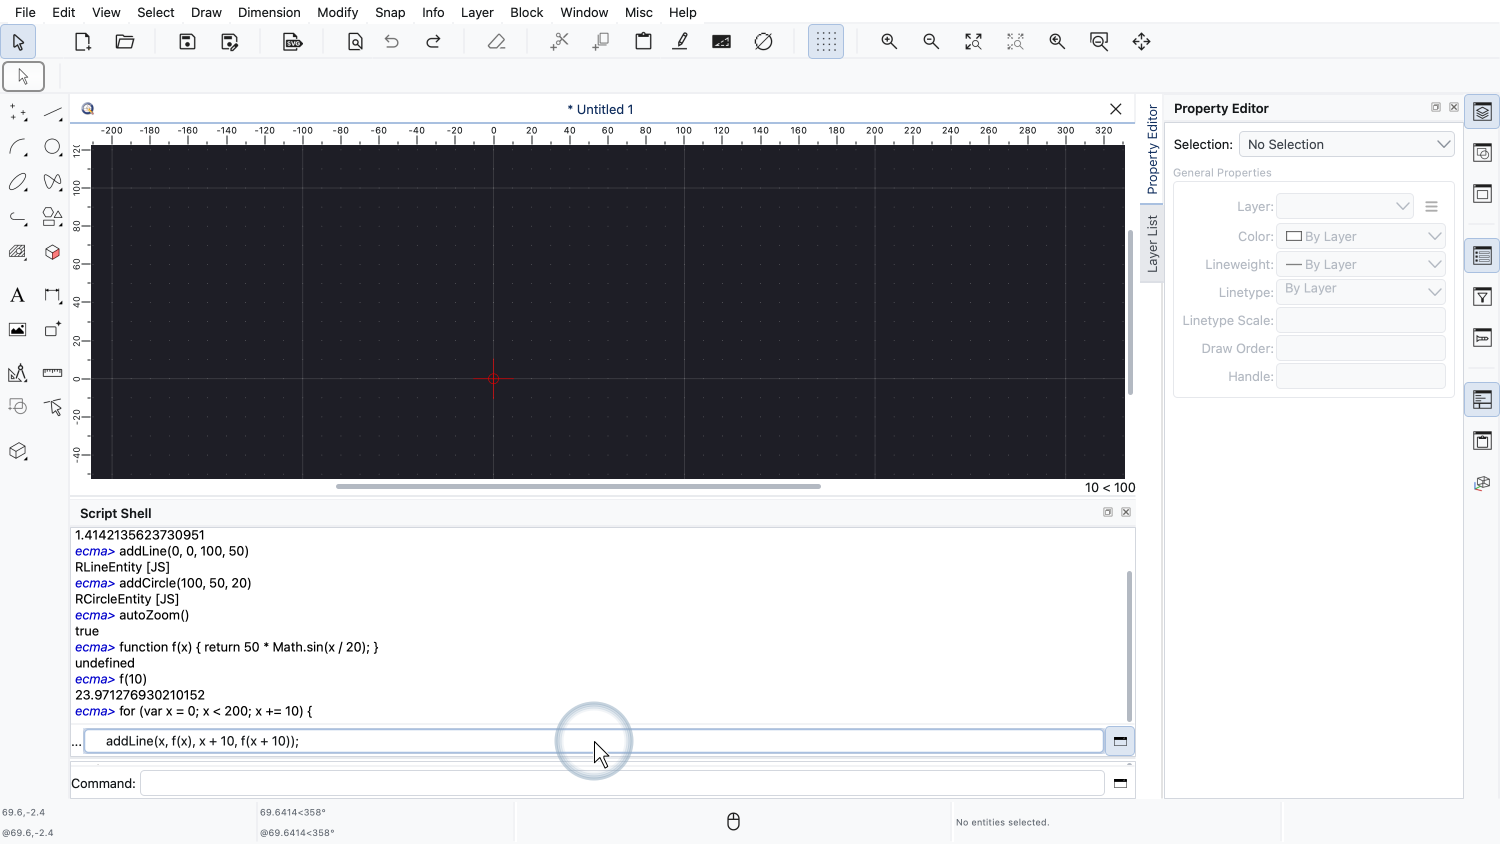

Inside the loop, we add a line from the current x value and f of x to the next x value and f of the next x value.
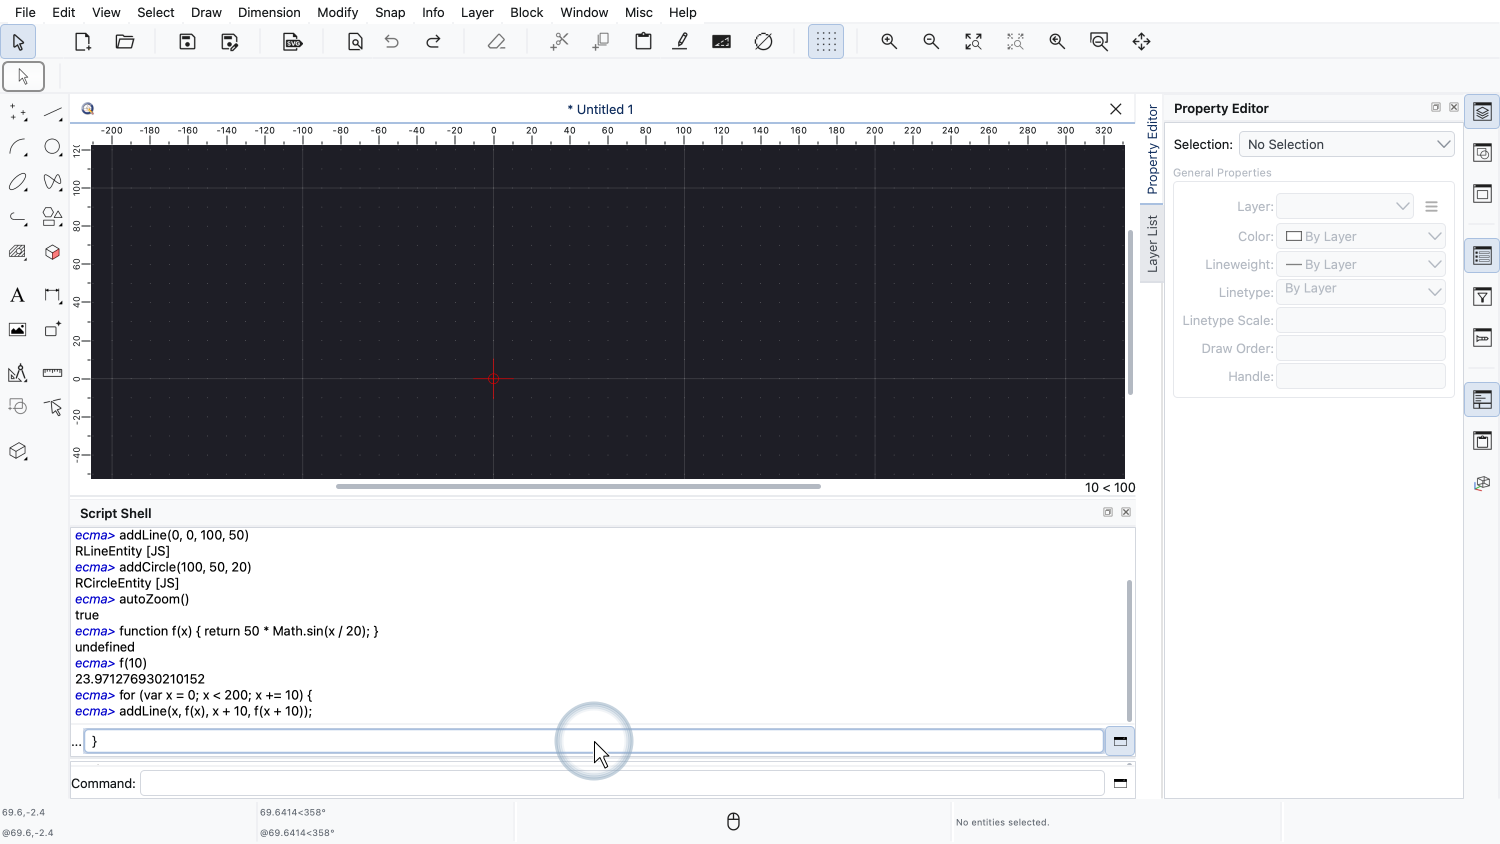
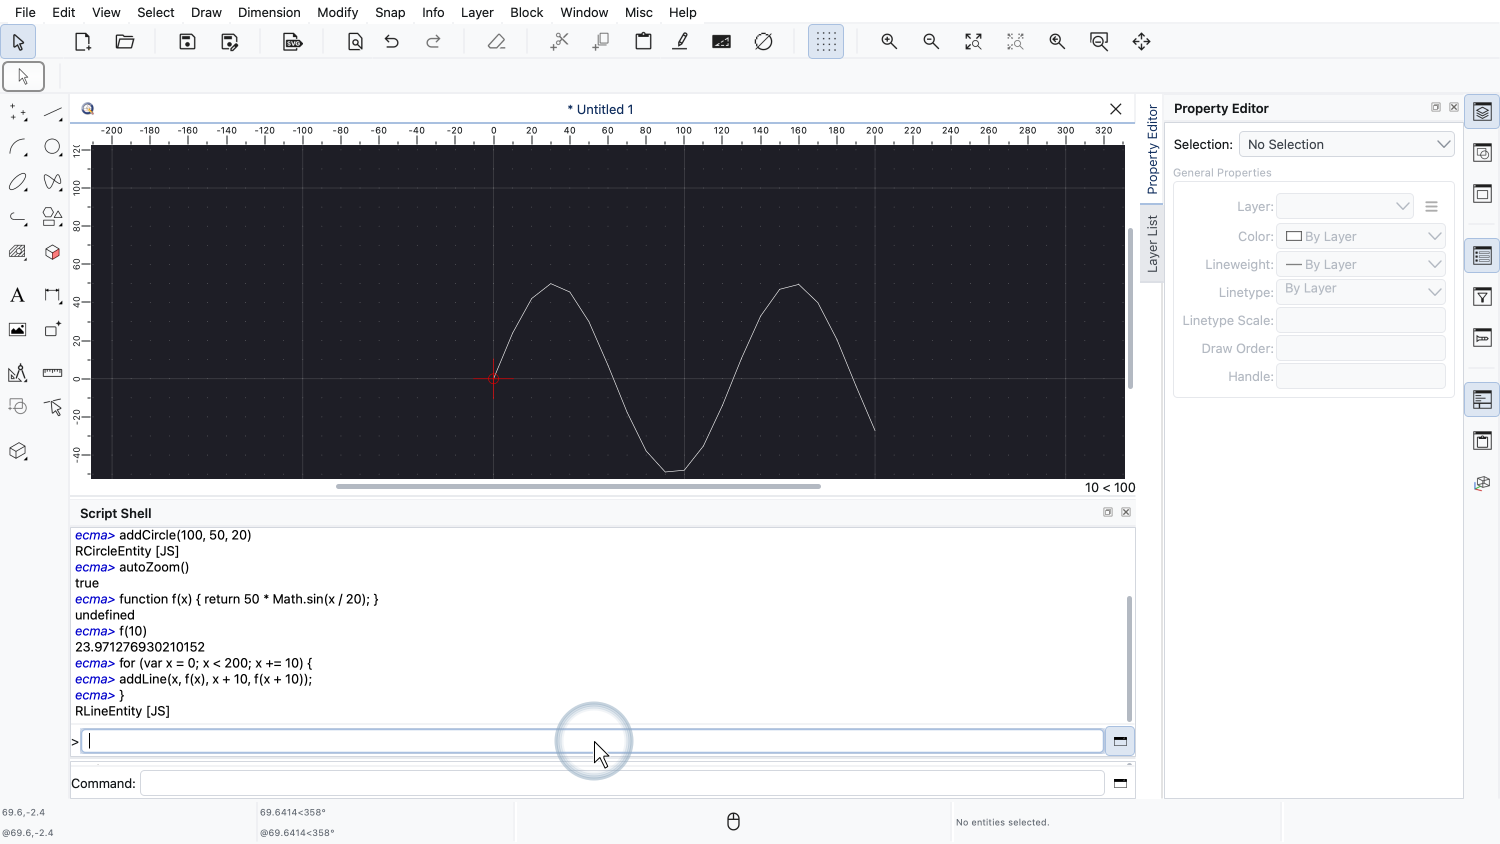
The closing brace ends the loop. As soon as we confirm it, the shell runs the whole loop.
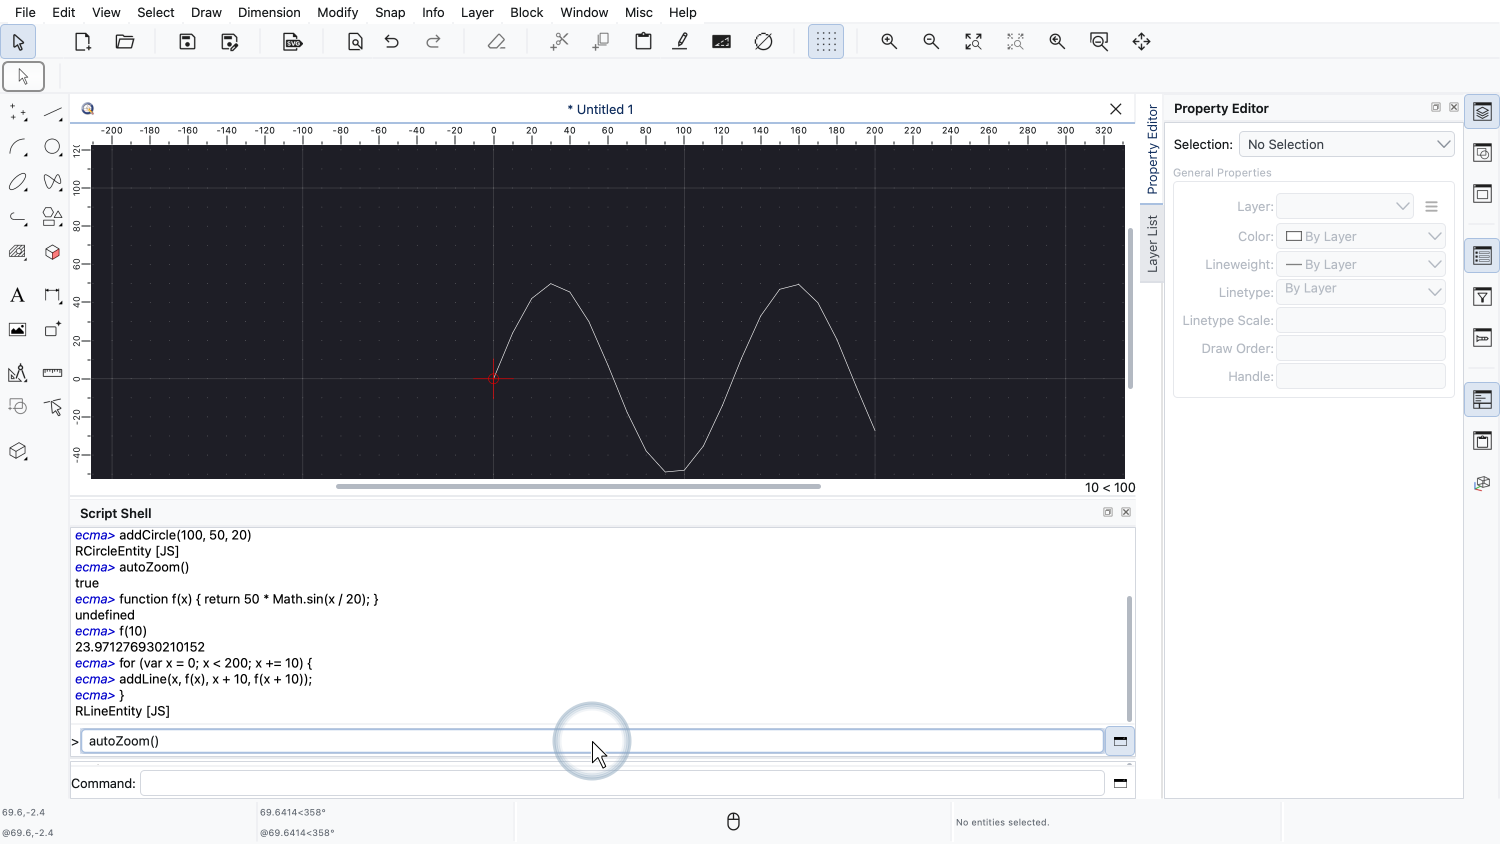
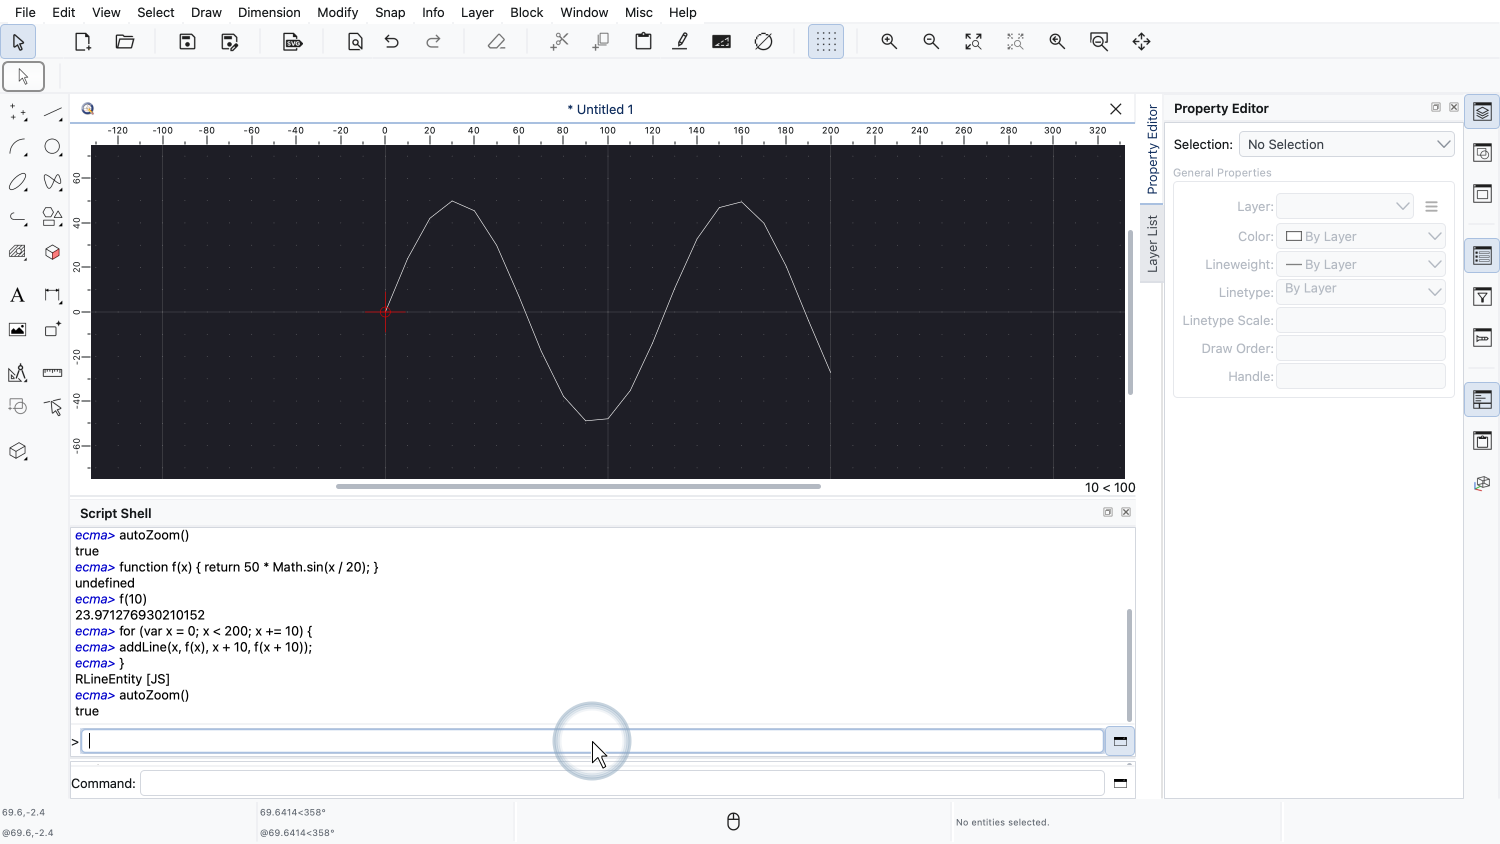
We zoom to the result.
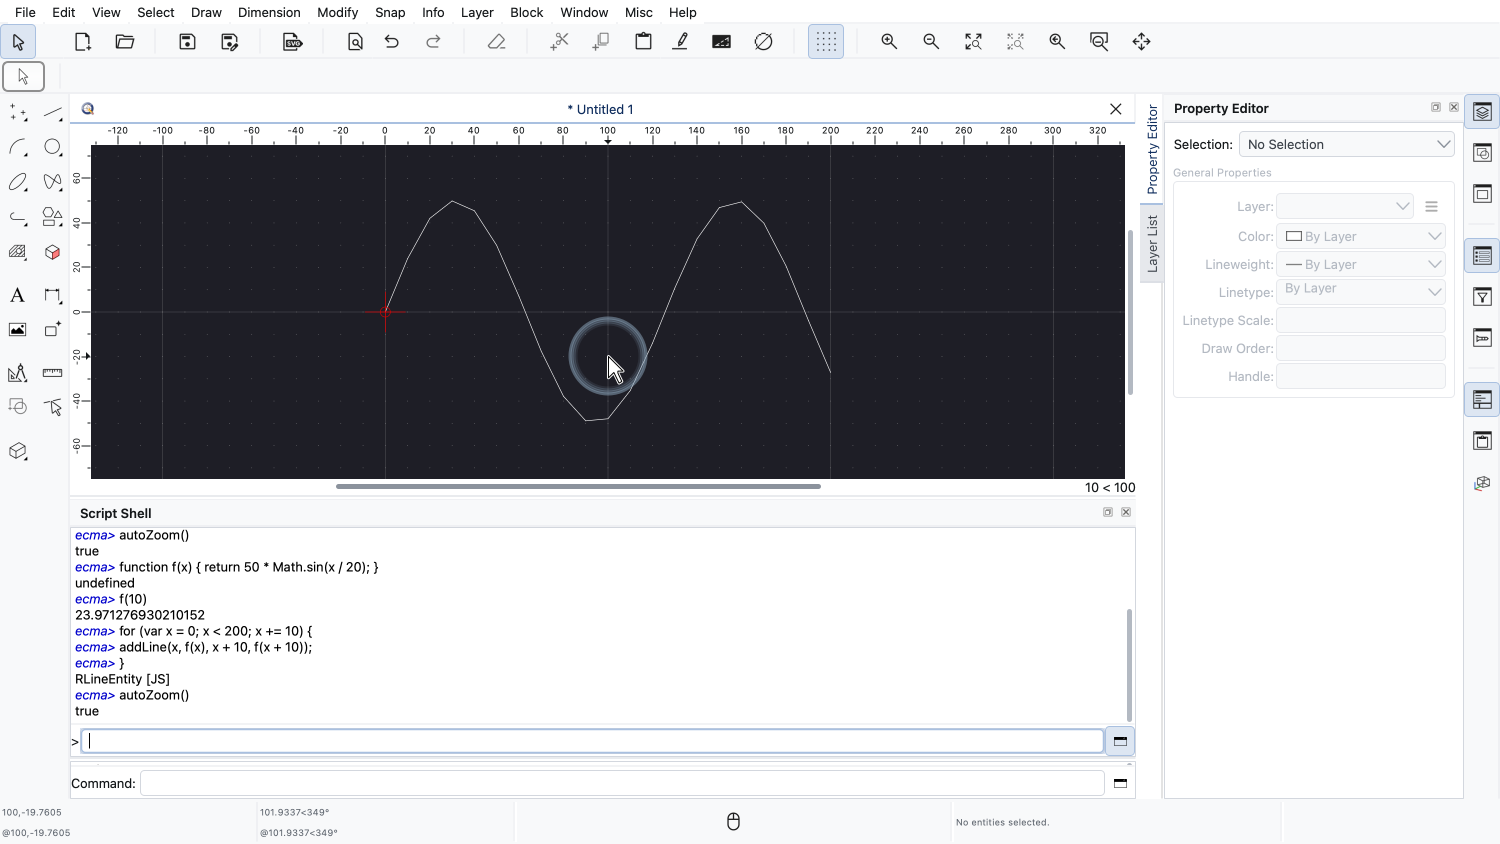
The graph of our sine function appears in the drawing.
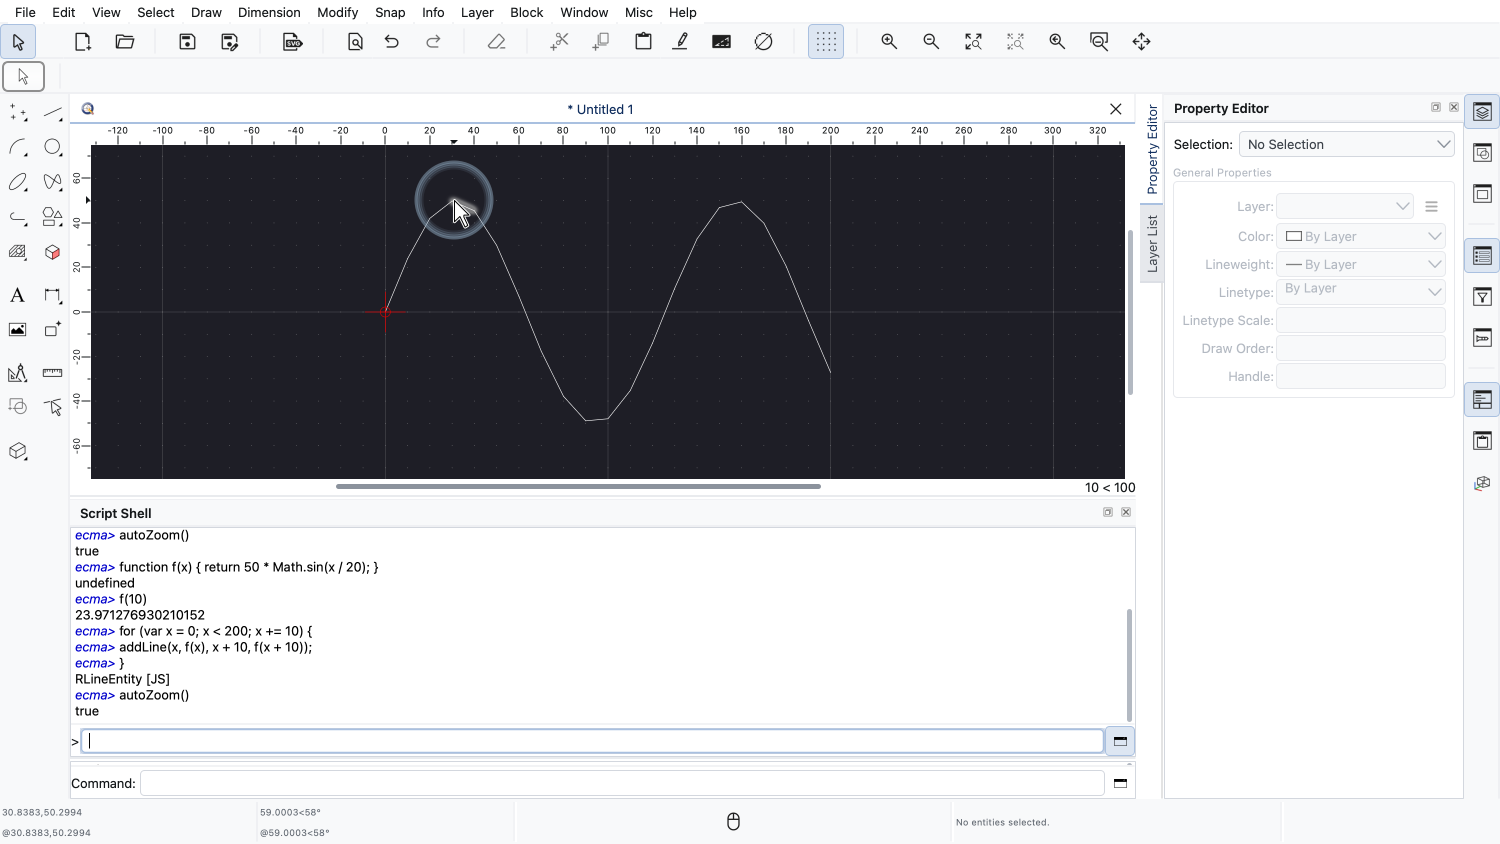
Since we only sampled the function every 10 units, the graph looks quite angular.
We could use a smaller step to get a smoother graph. But let's first have a look at what we have created.
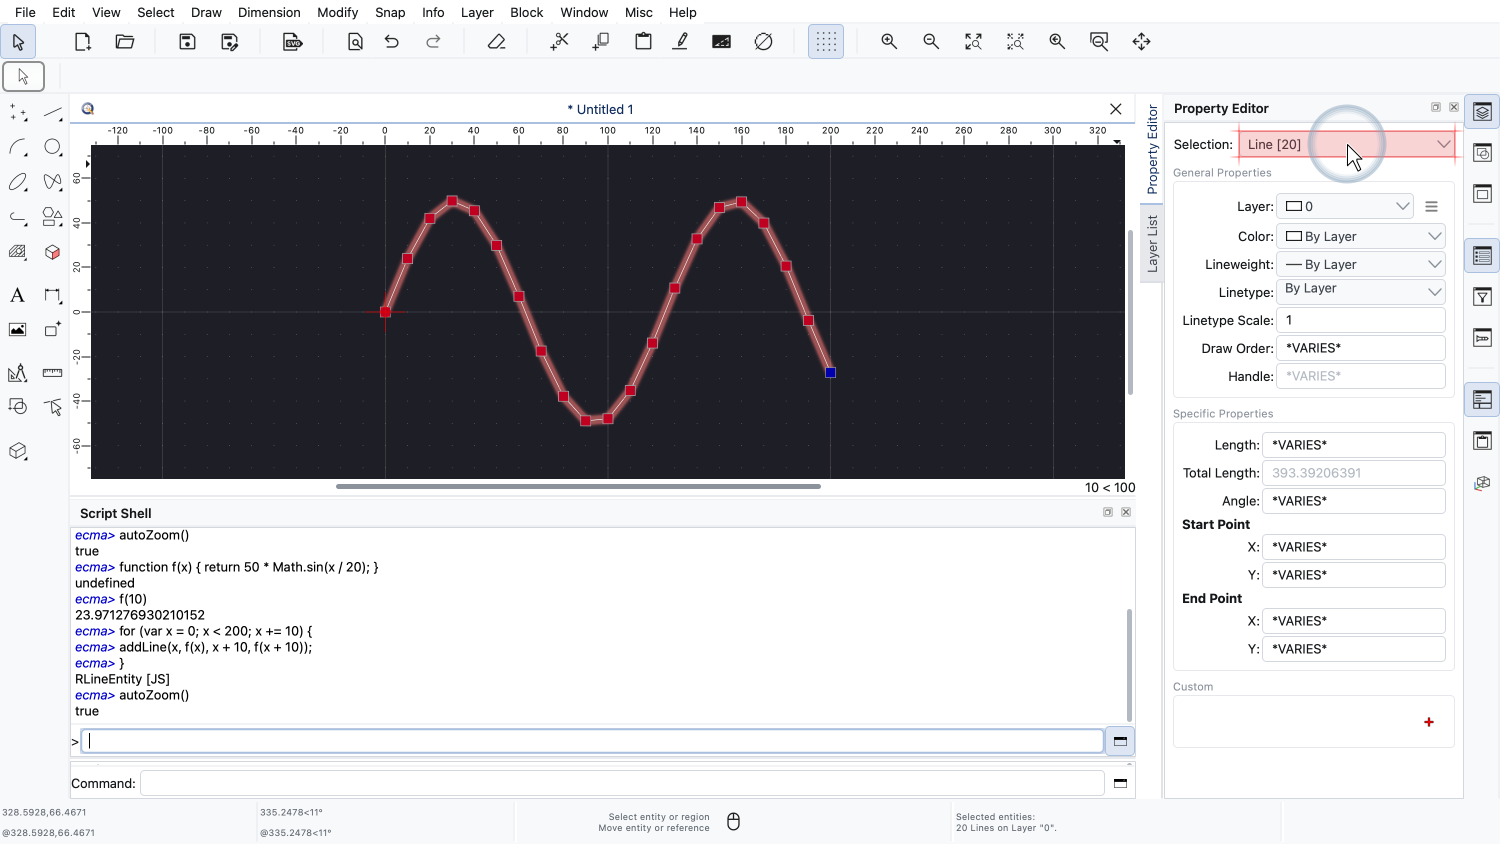
The property editor shows that our graph consists of 20 individual lines.
This works, but it is not ideal. The lines are individual objects and a smoother graph with a smaller step would consist of hundreds of lines.
A single polyline would be a much better representation of the graph.
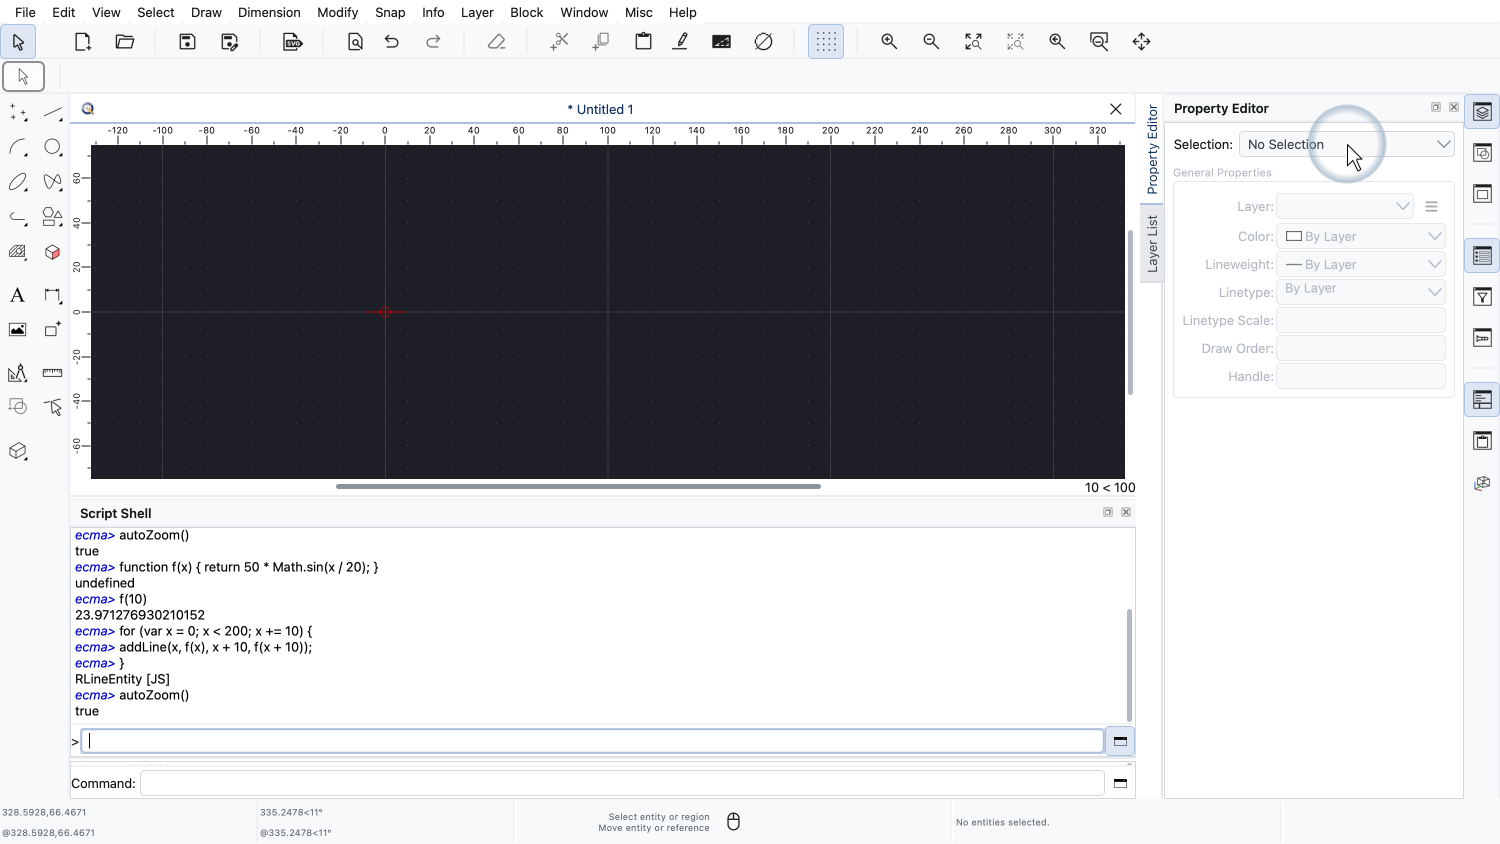
We delete the lines again.
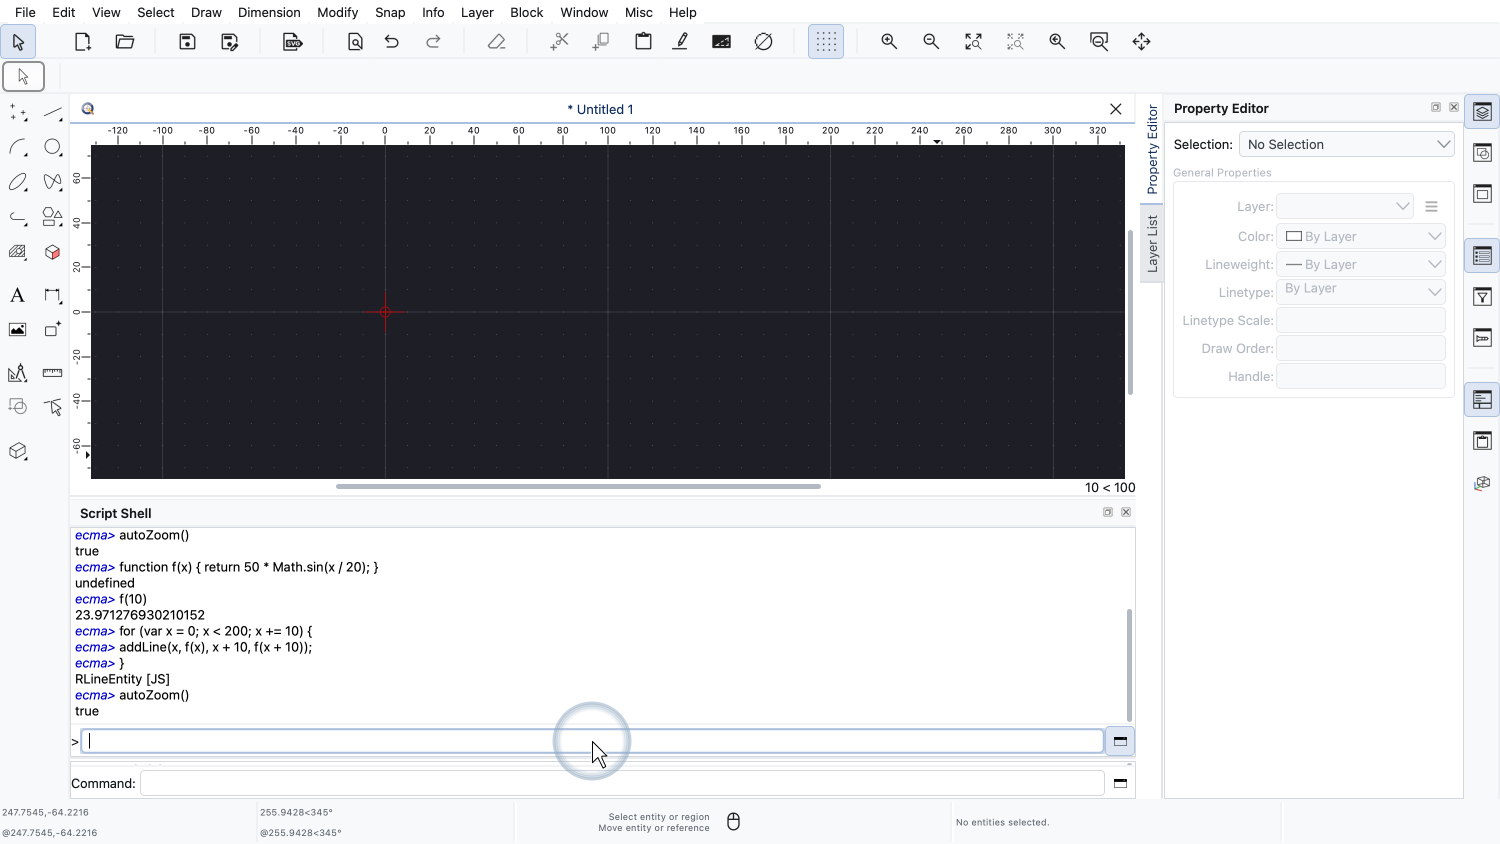
Instead of adding a line in each step of the loop, we now collect the points of the graph in a list.
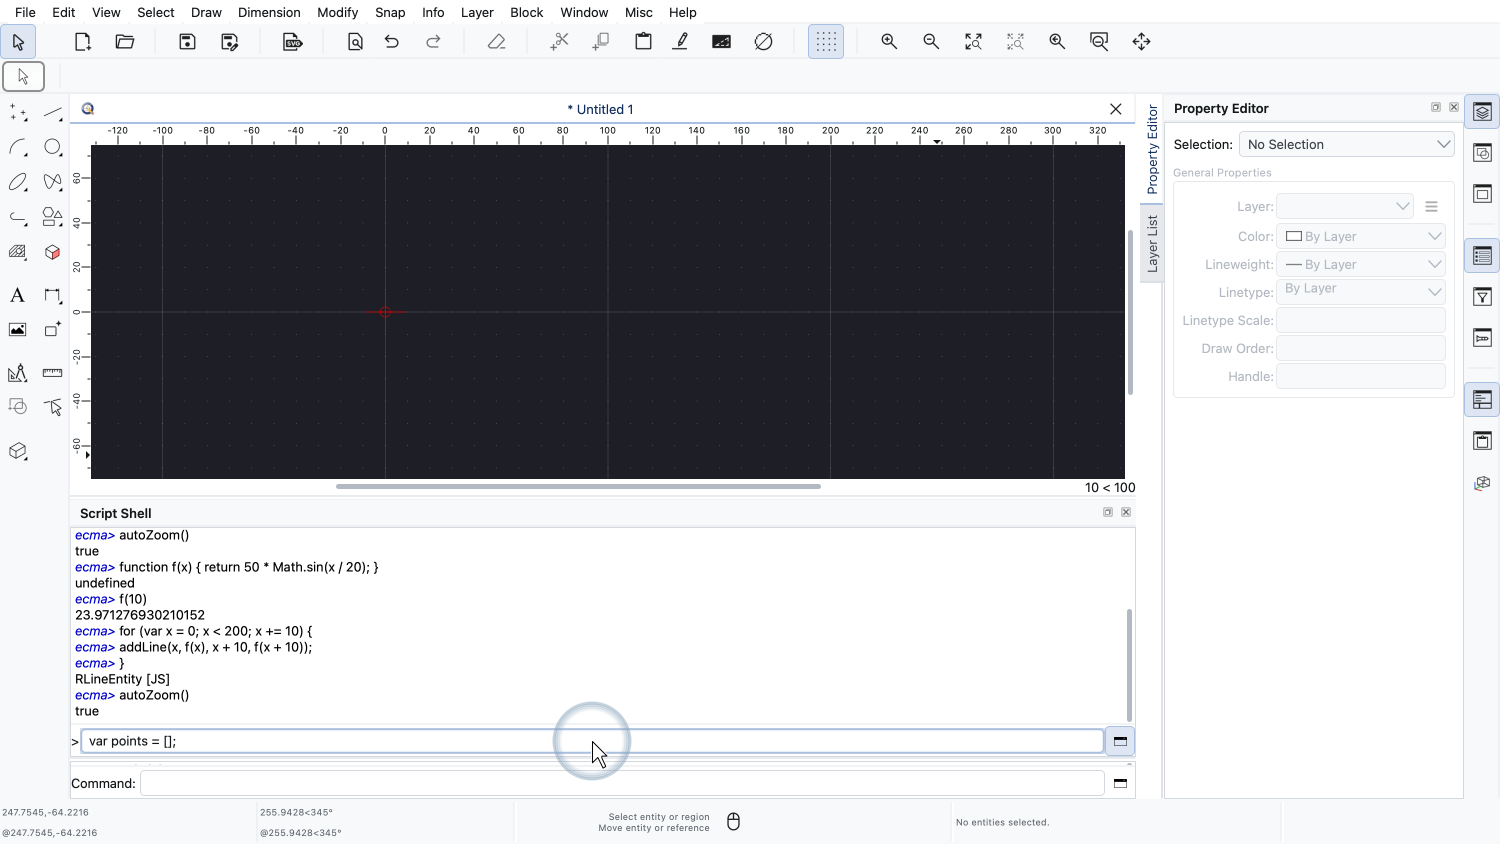

We start with an empty list called points.
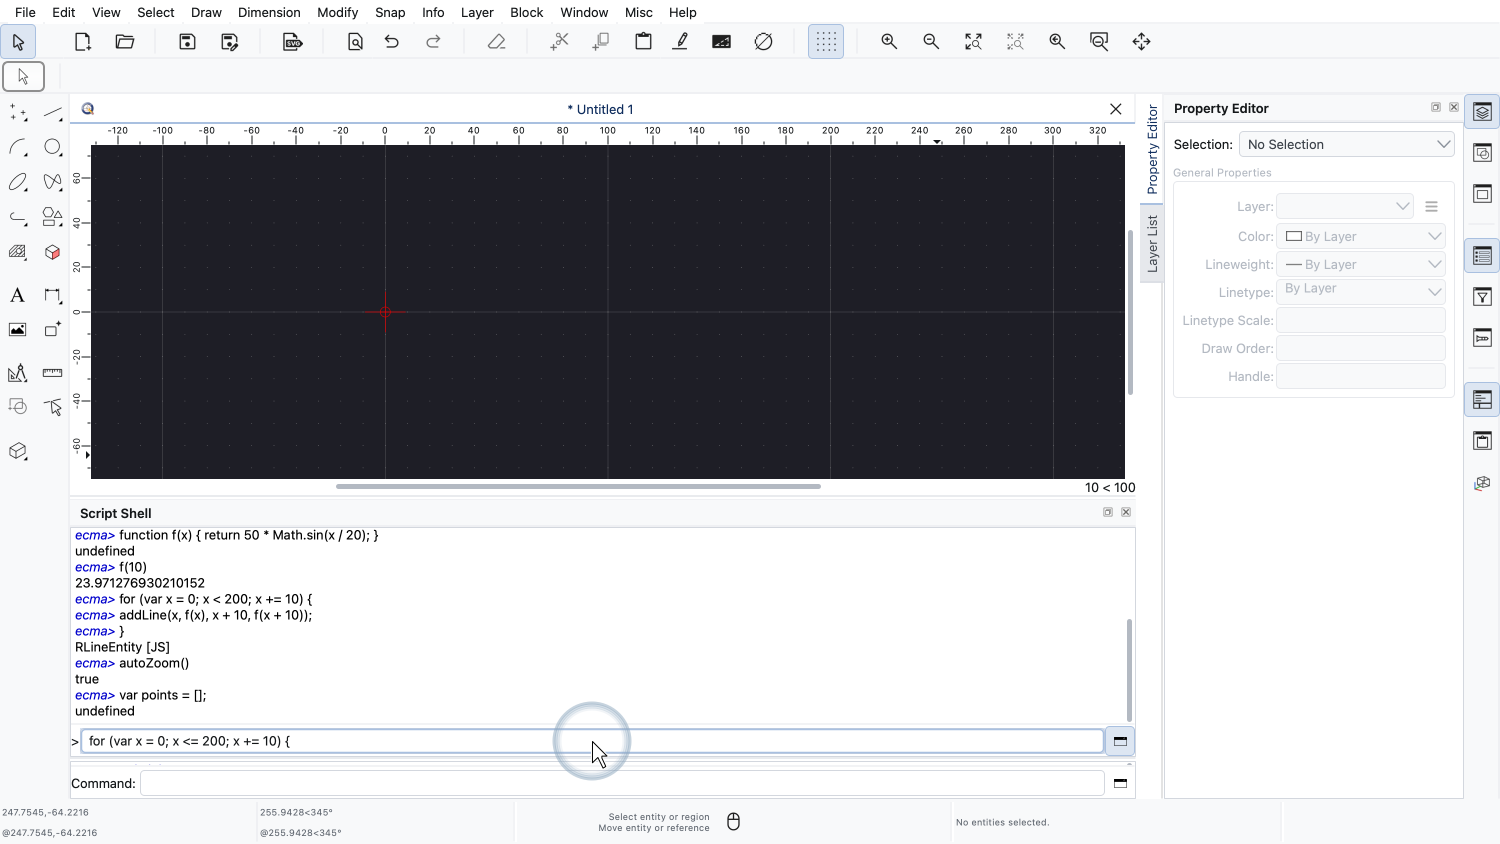
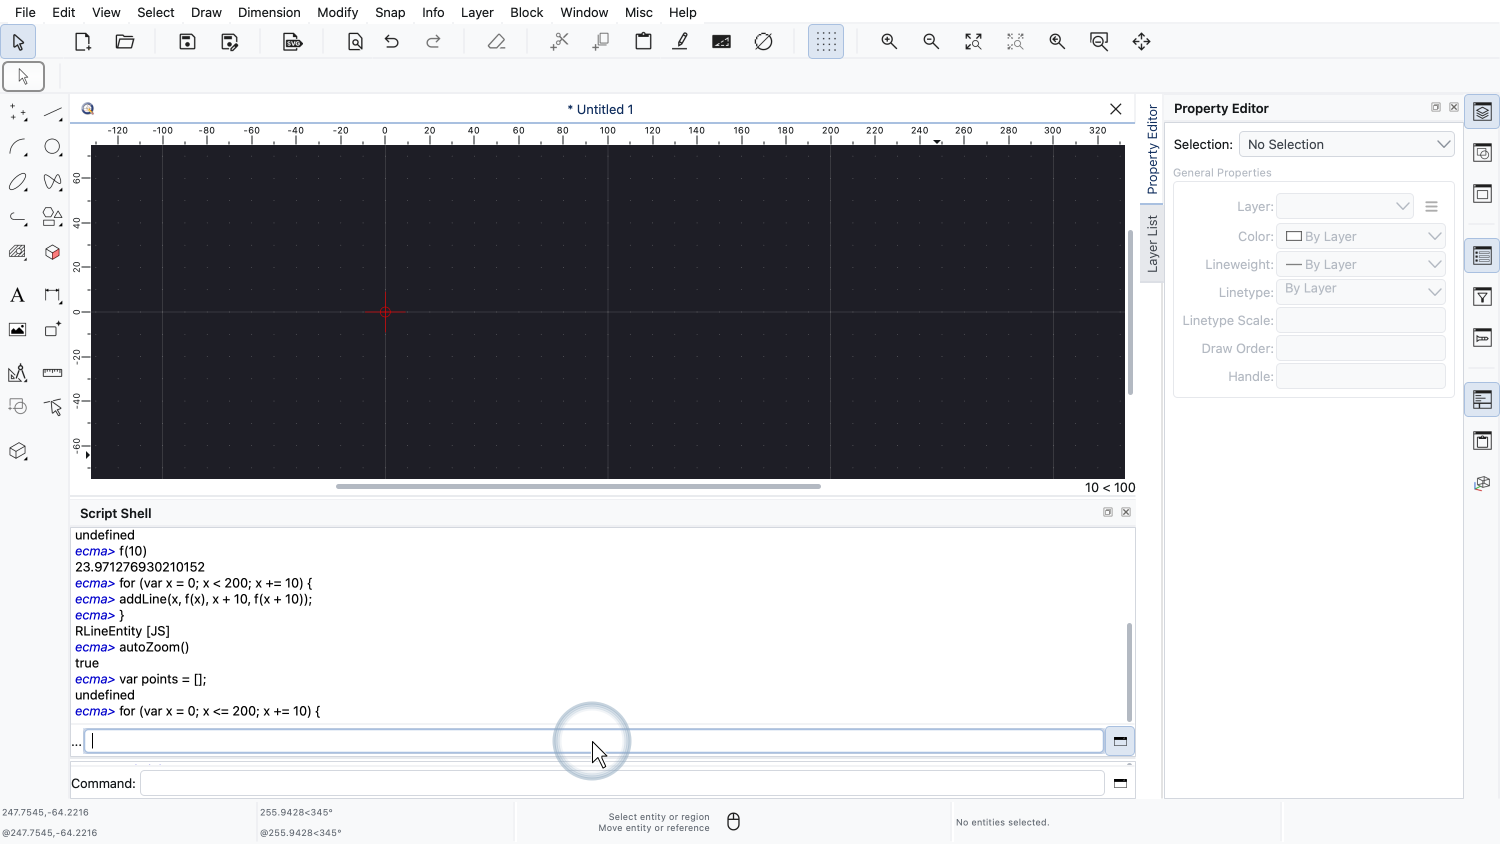
The loop looks almost the same as before. This time, x runs up to and including 200, since we need the last point of the graph as well.
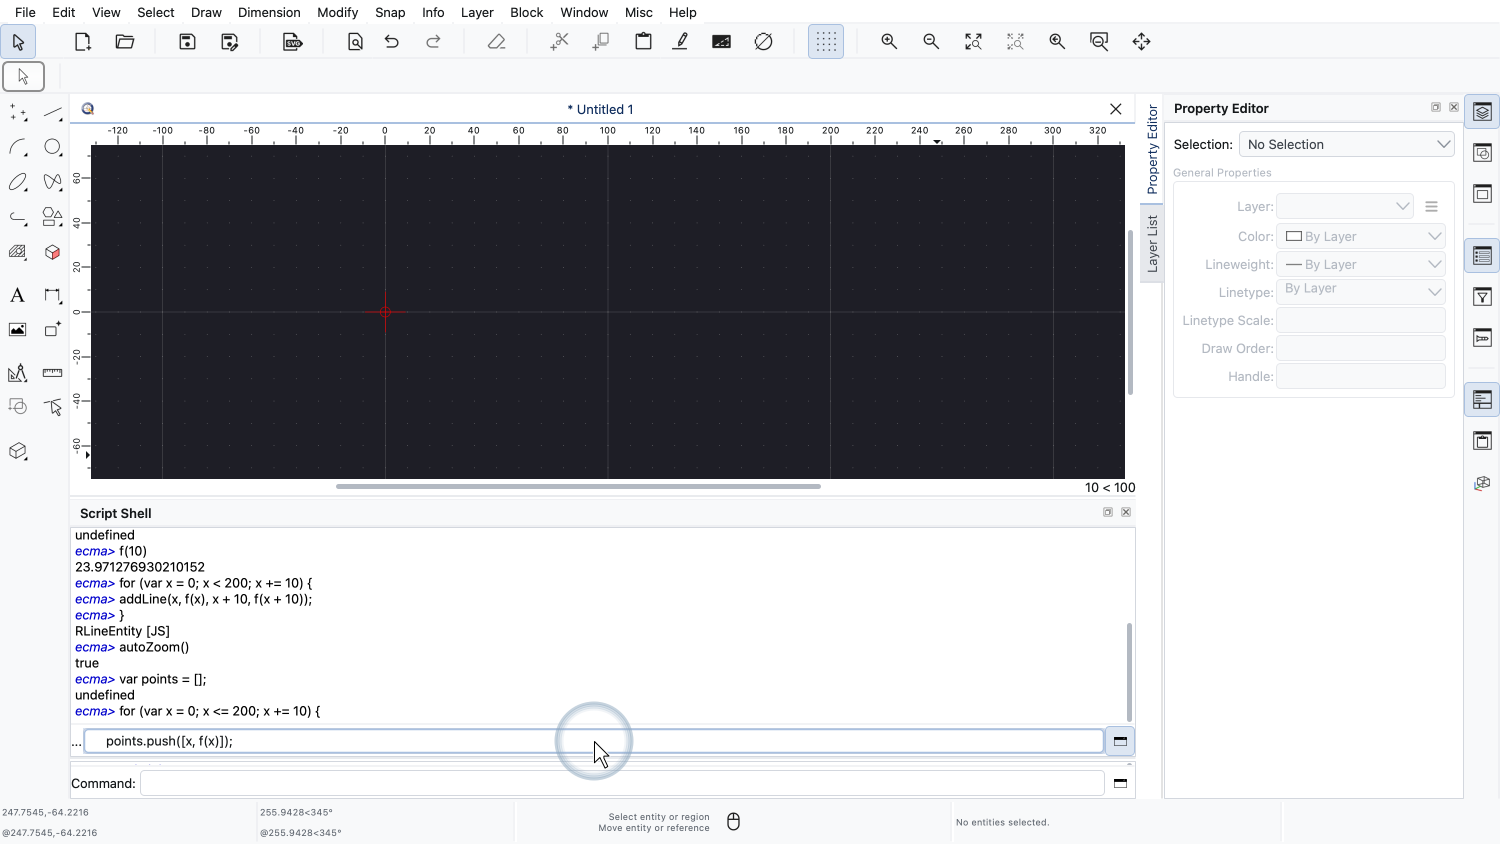
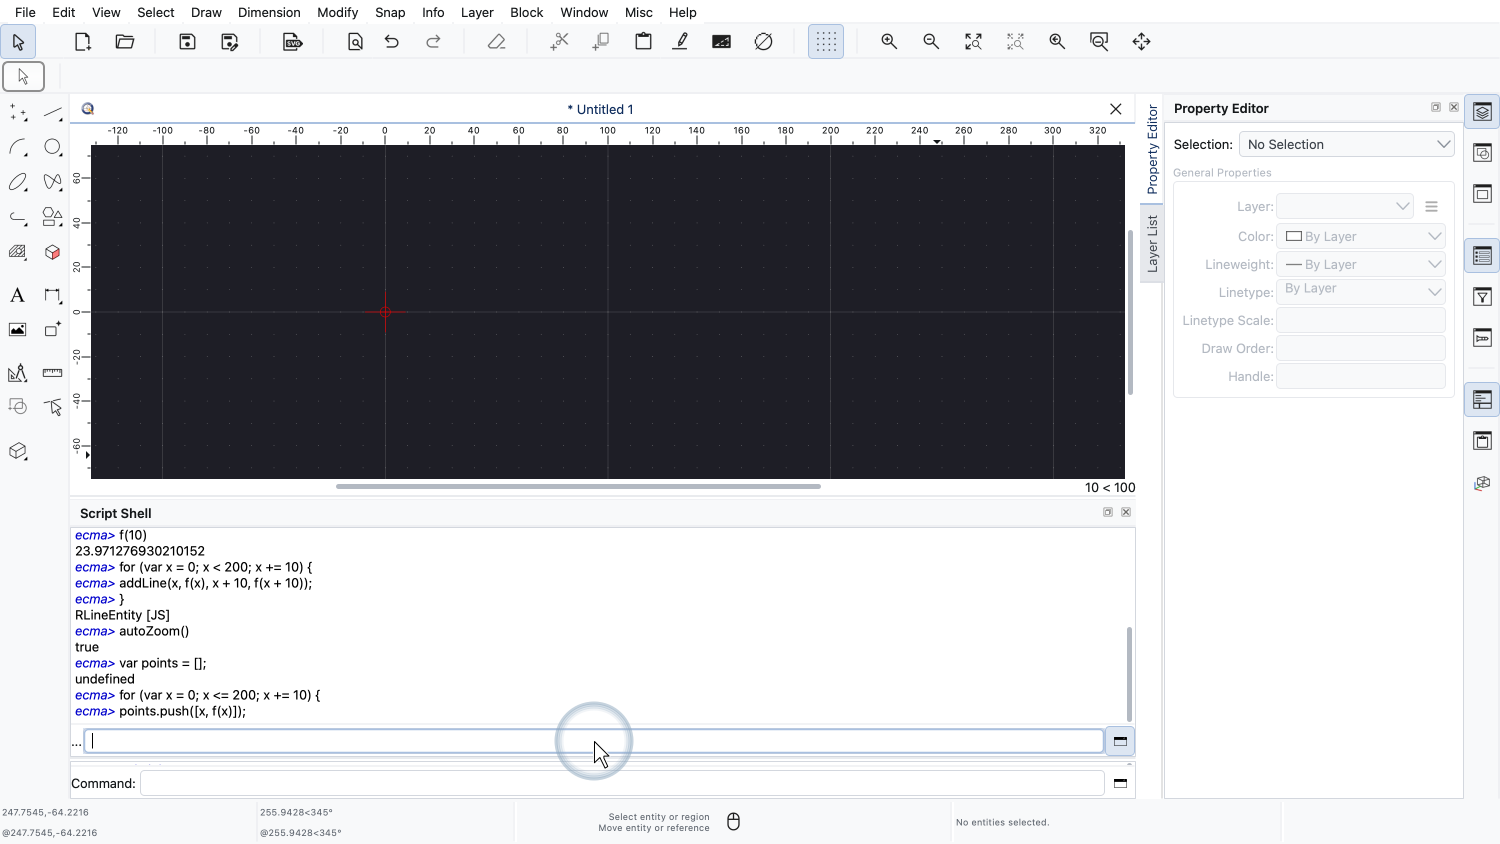
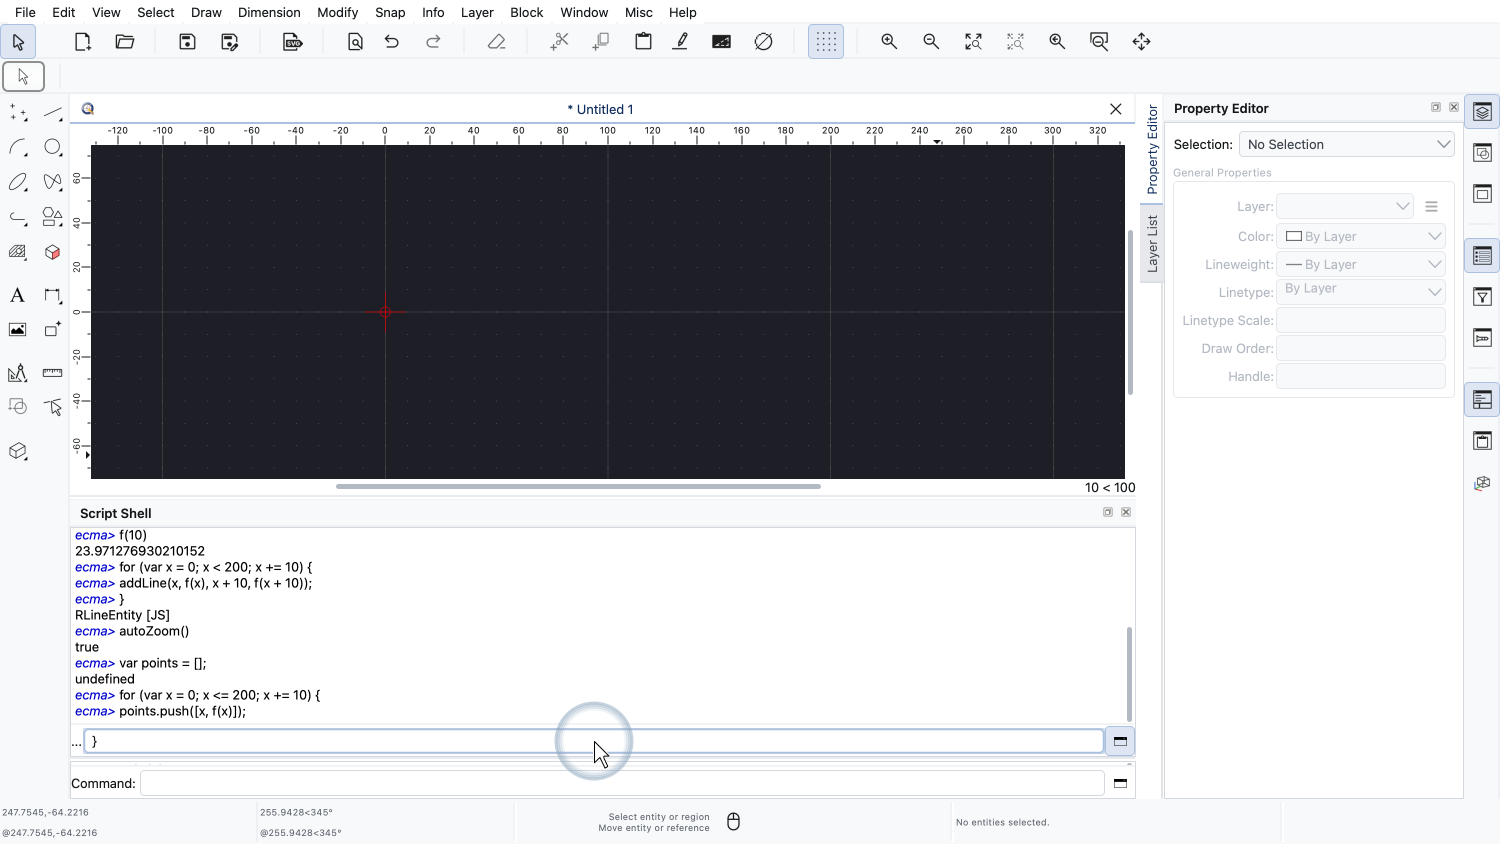
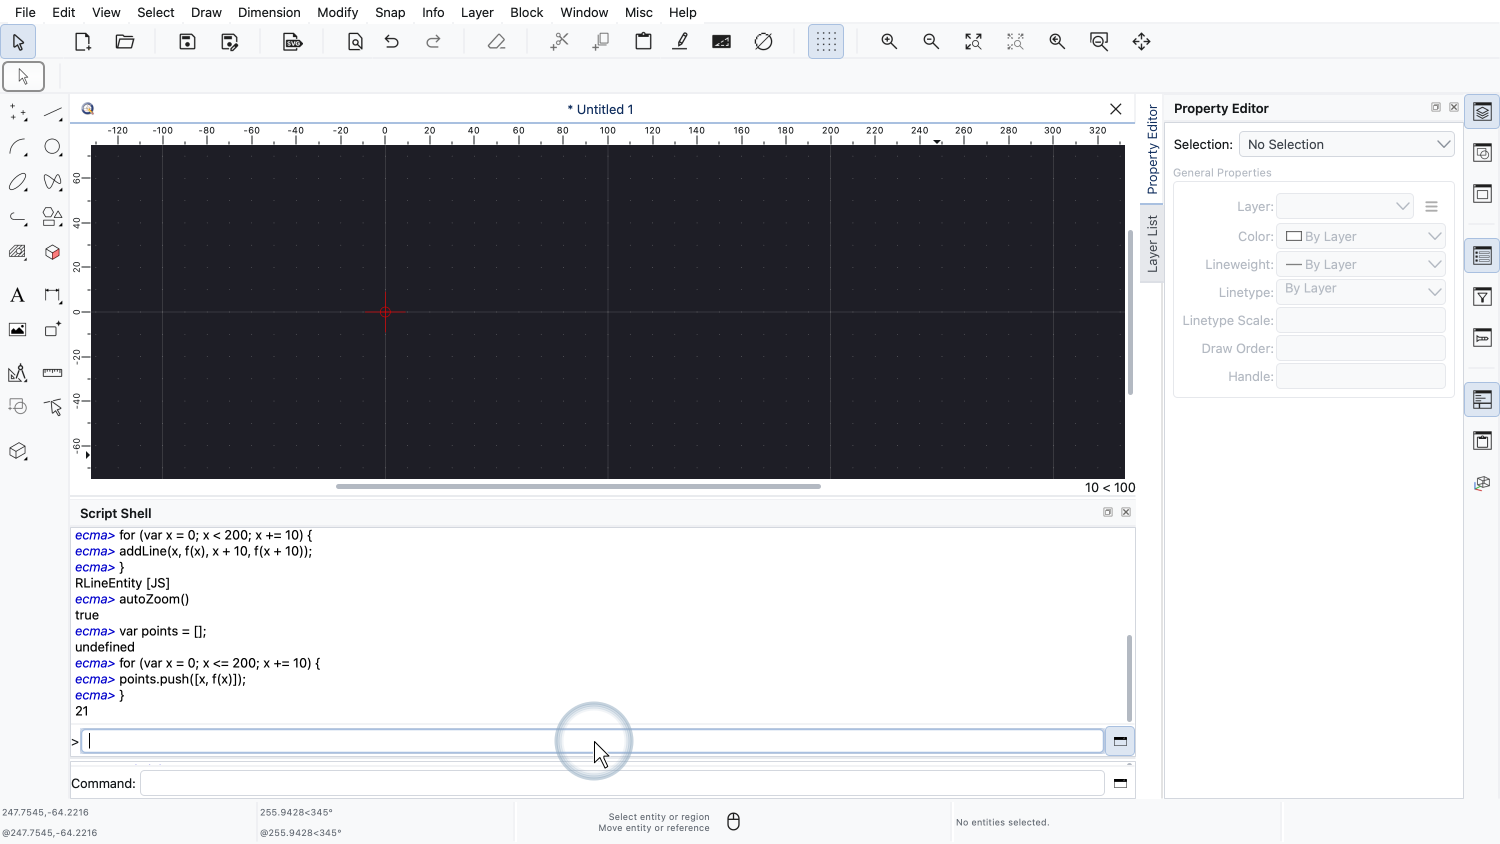
In each step, we add the point with the coordinates x and f of x to our list. A point is written as a list with two values, the X and the Y coordinate.
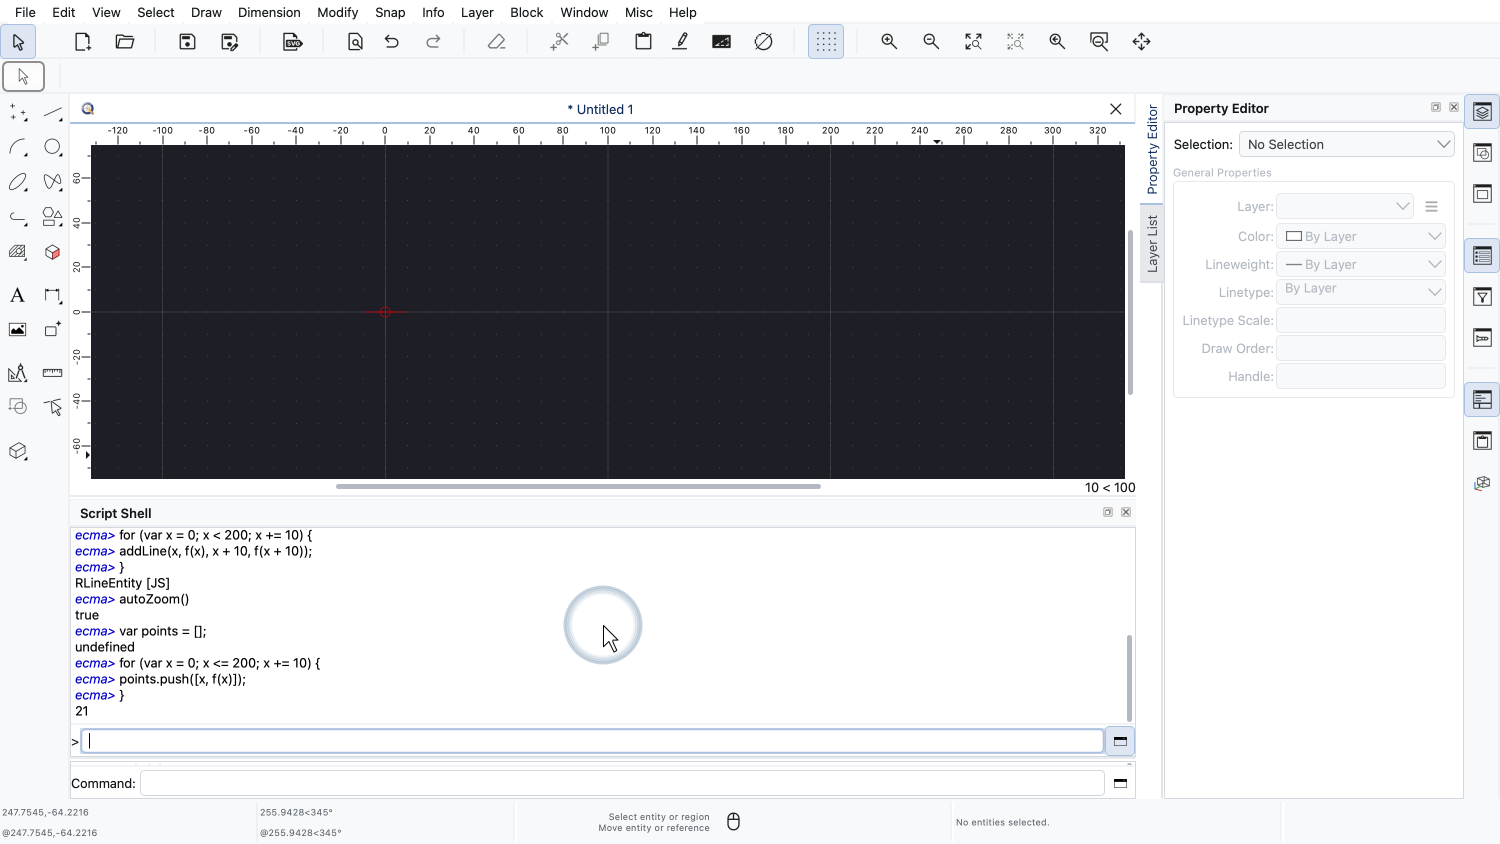
The loop has now filled our list with 21 points, but nothing has been added to the drawing yet.
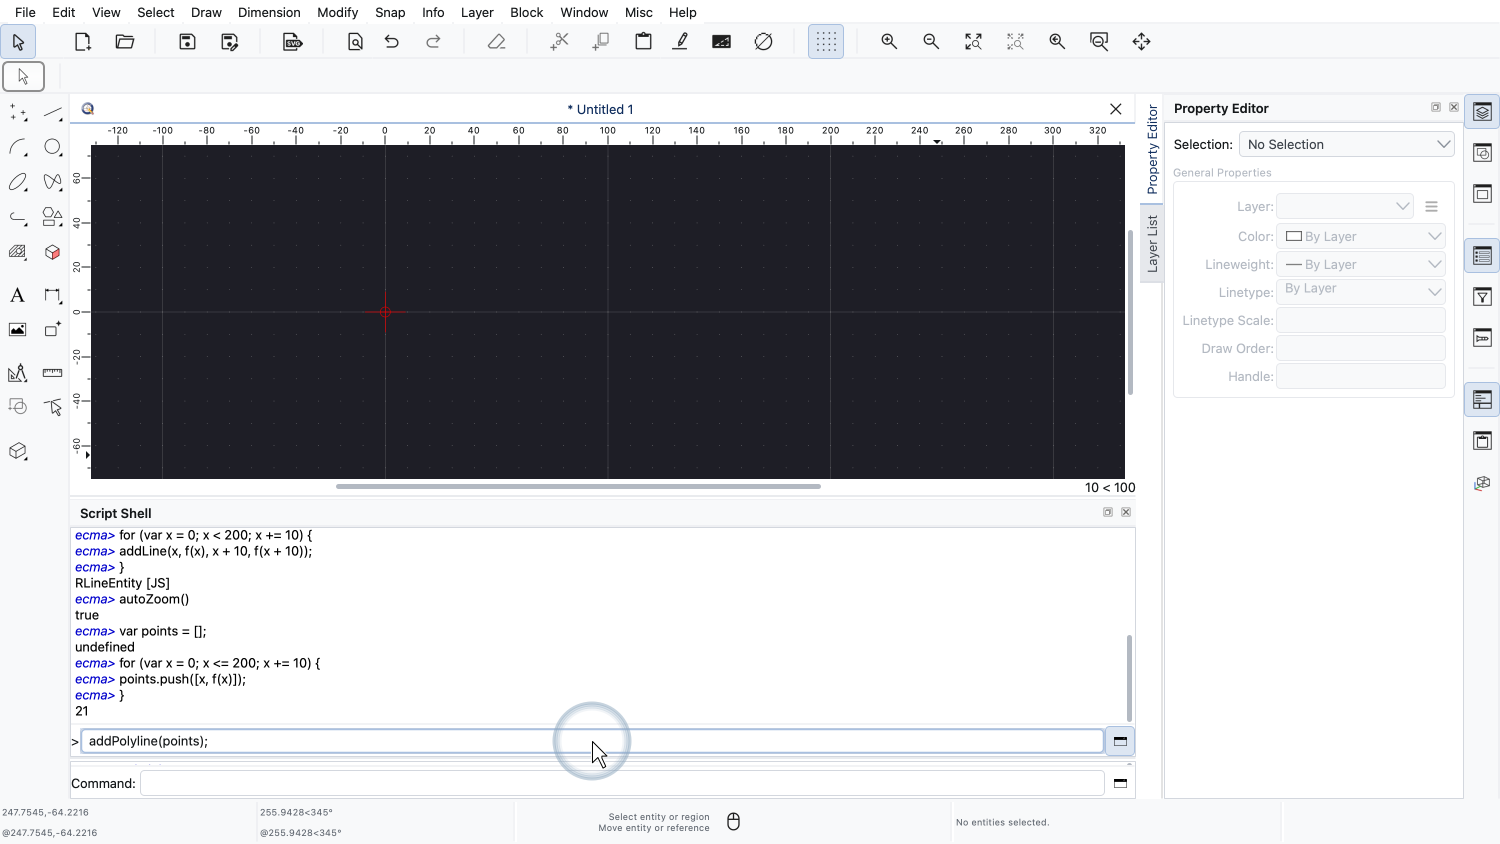

Finally, we pass the list of points to the function addPolyline, which adds one polyline through all these points.
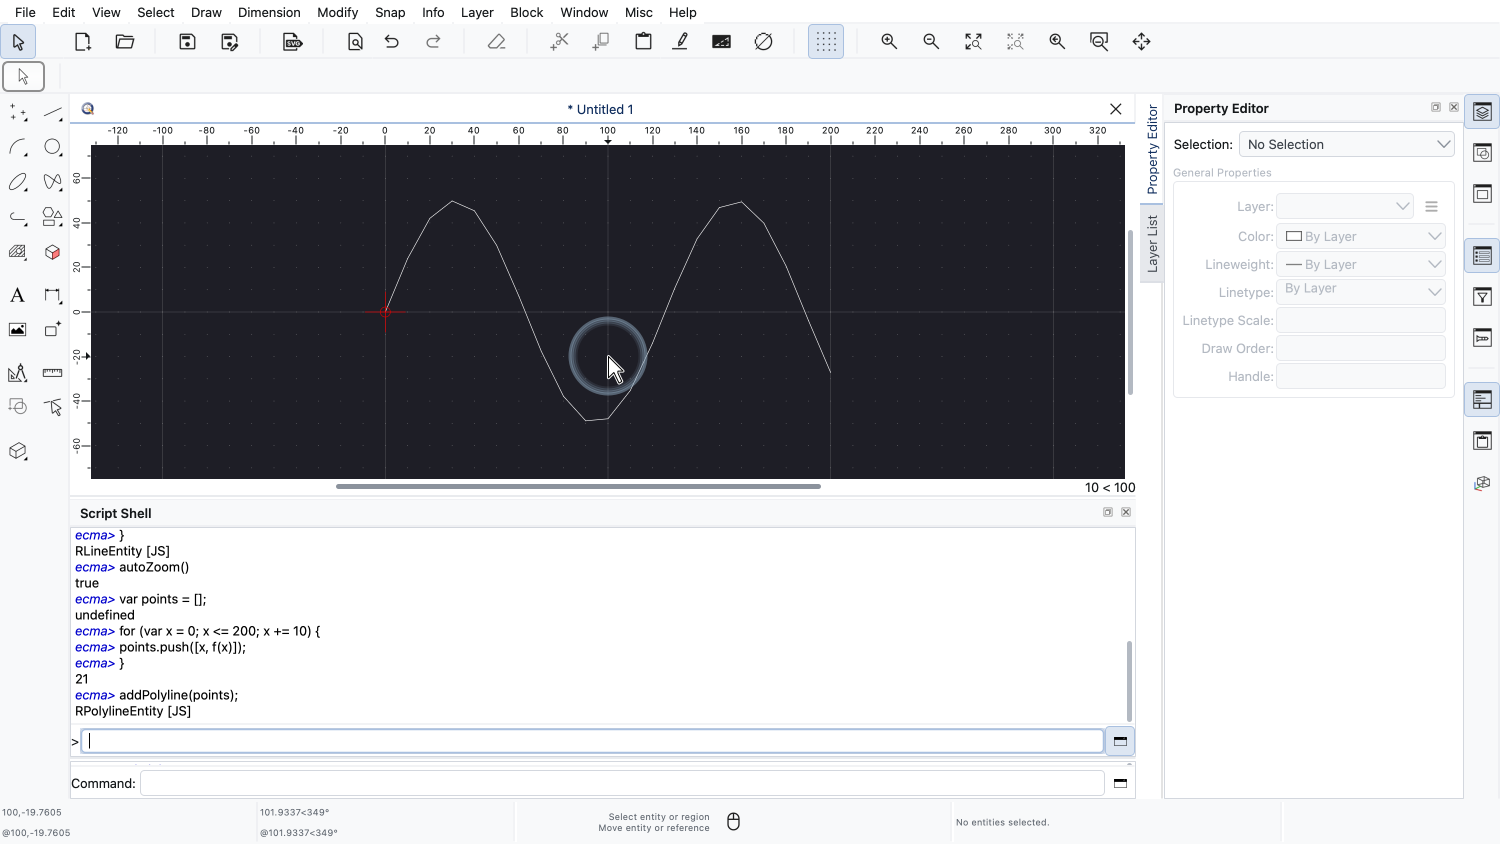
The graph looks exactly the same as before.
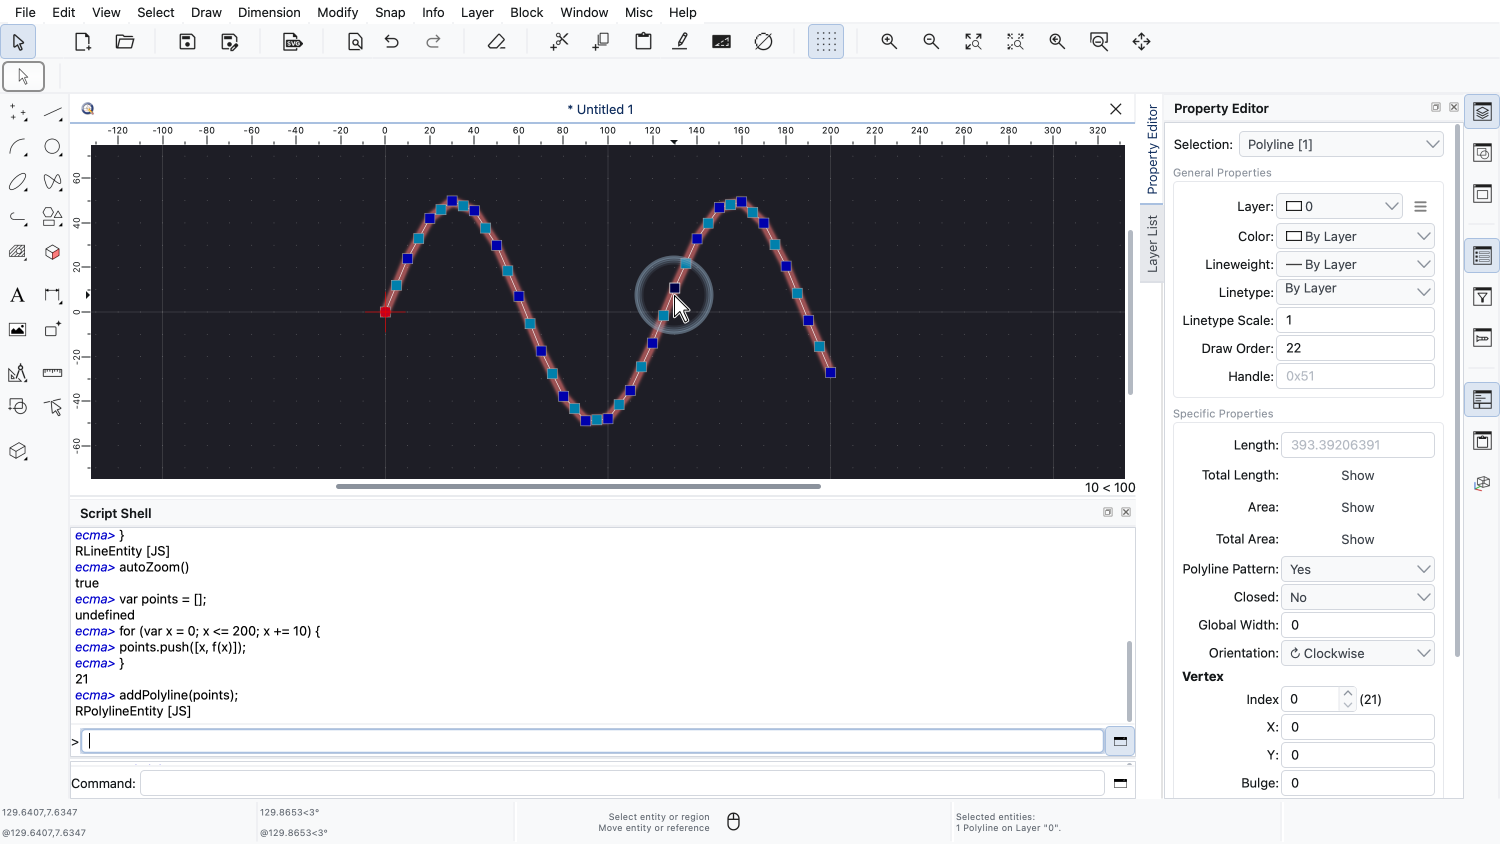
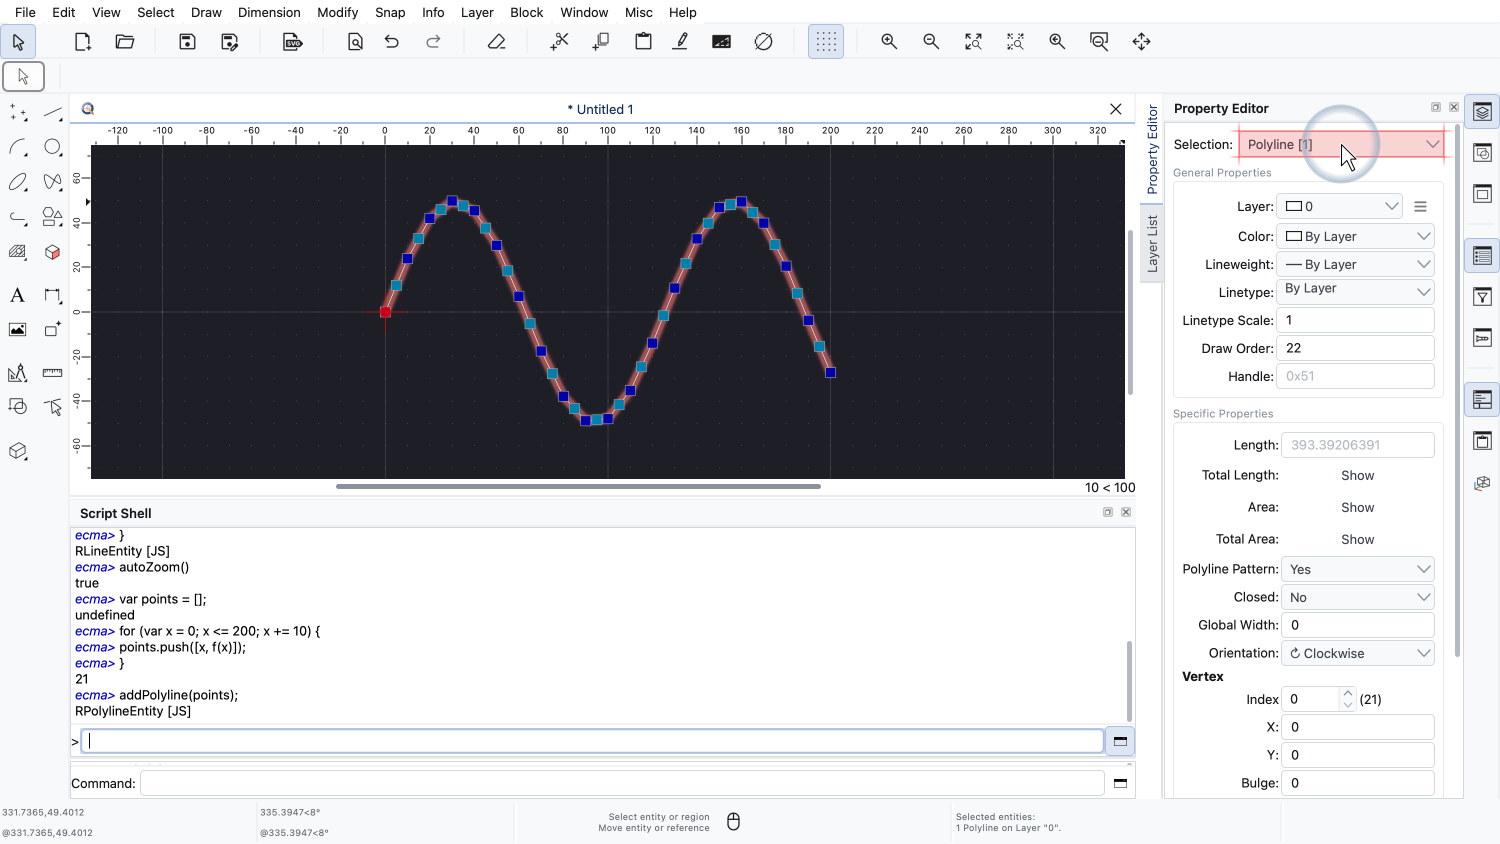
However, when we select it, the property editor shows that it is now a single polyline.
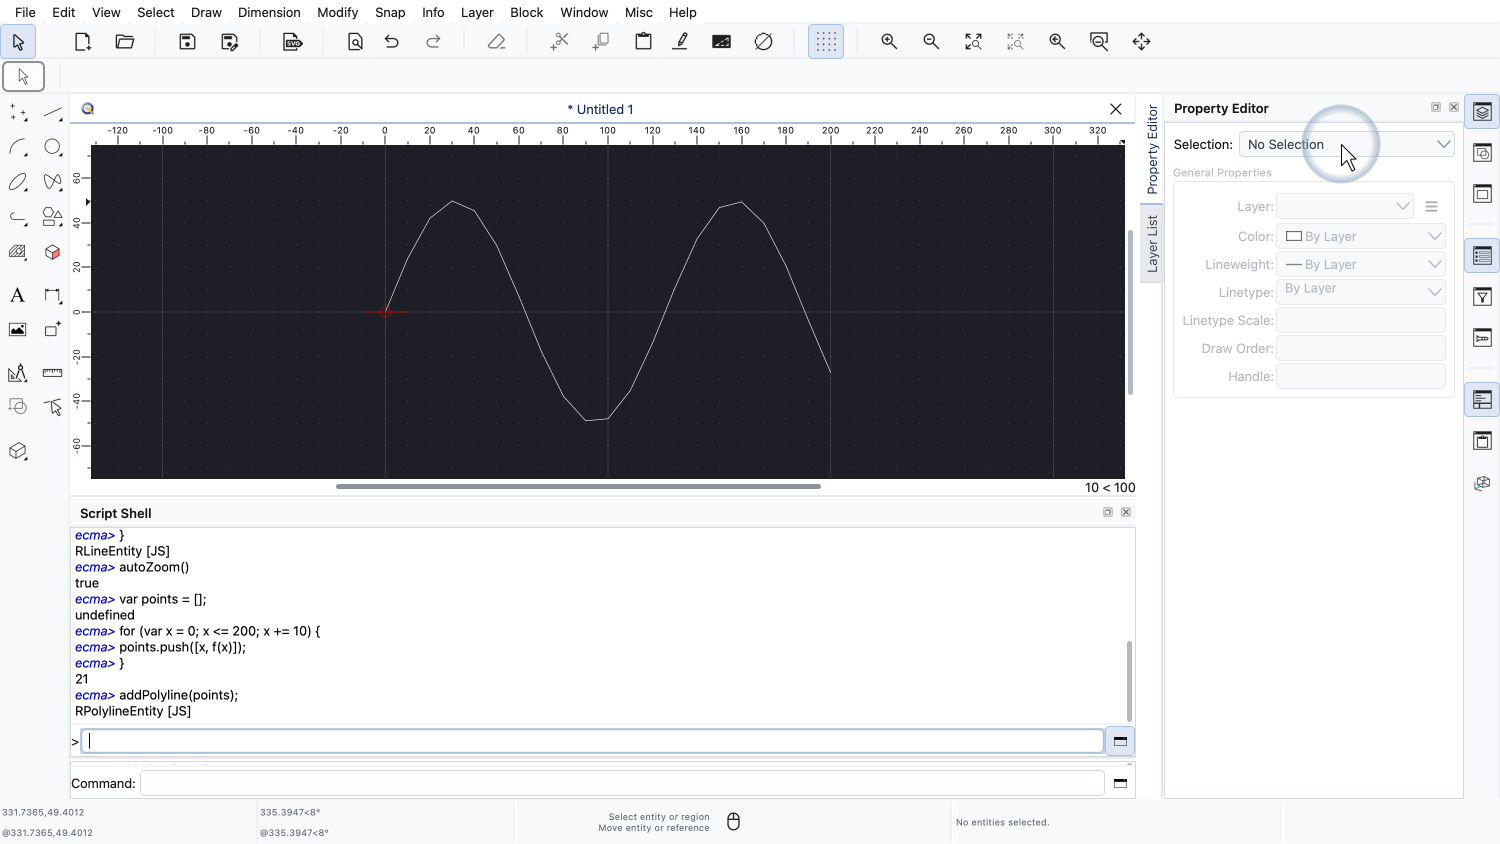
We deselect the polyline.
Now that our code is working, it is very easy to create a smoother version of the graph.
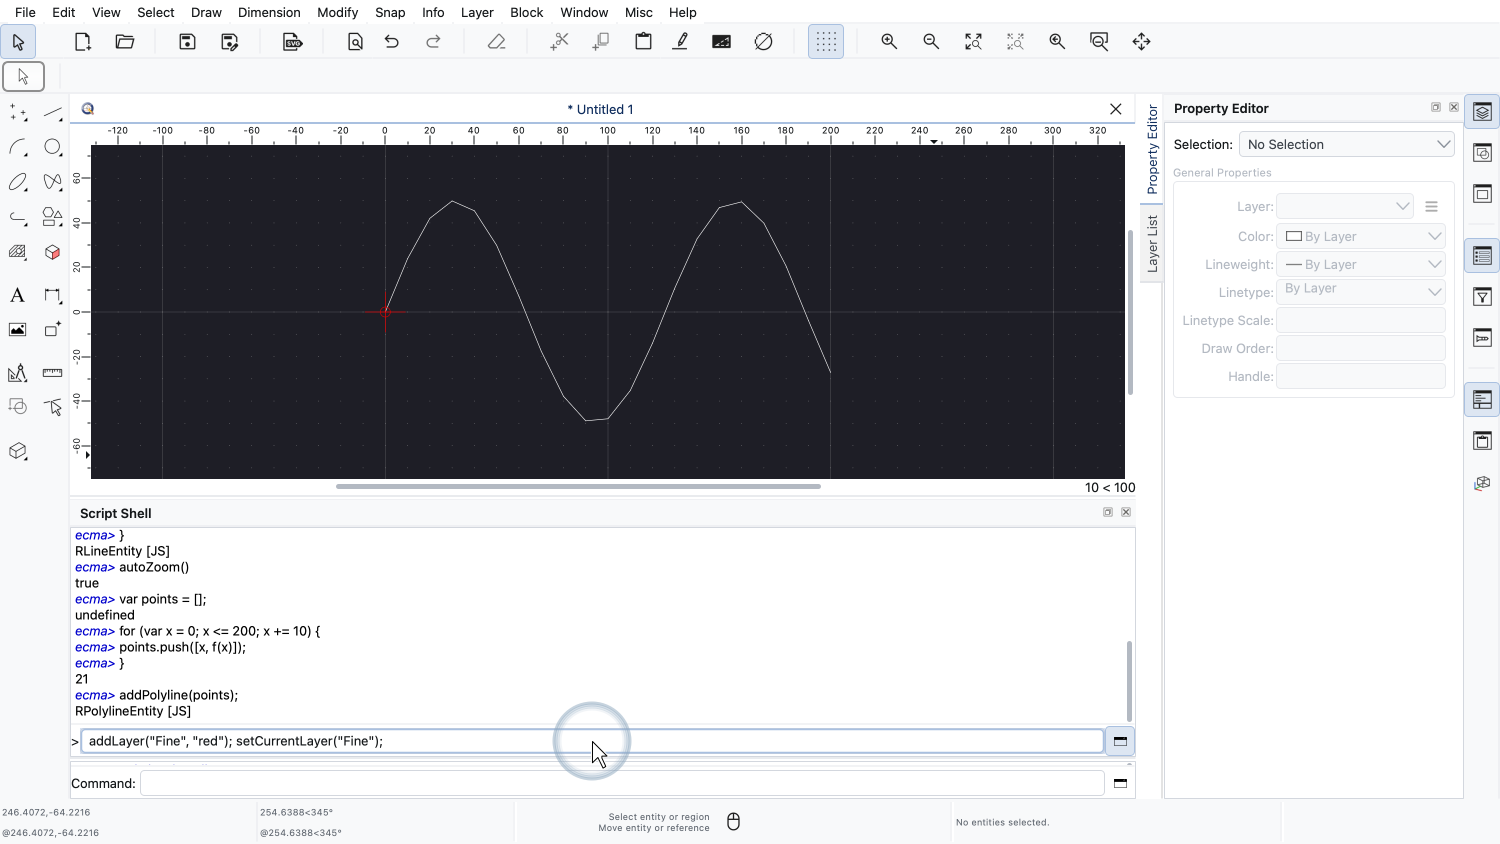
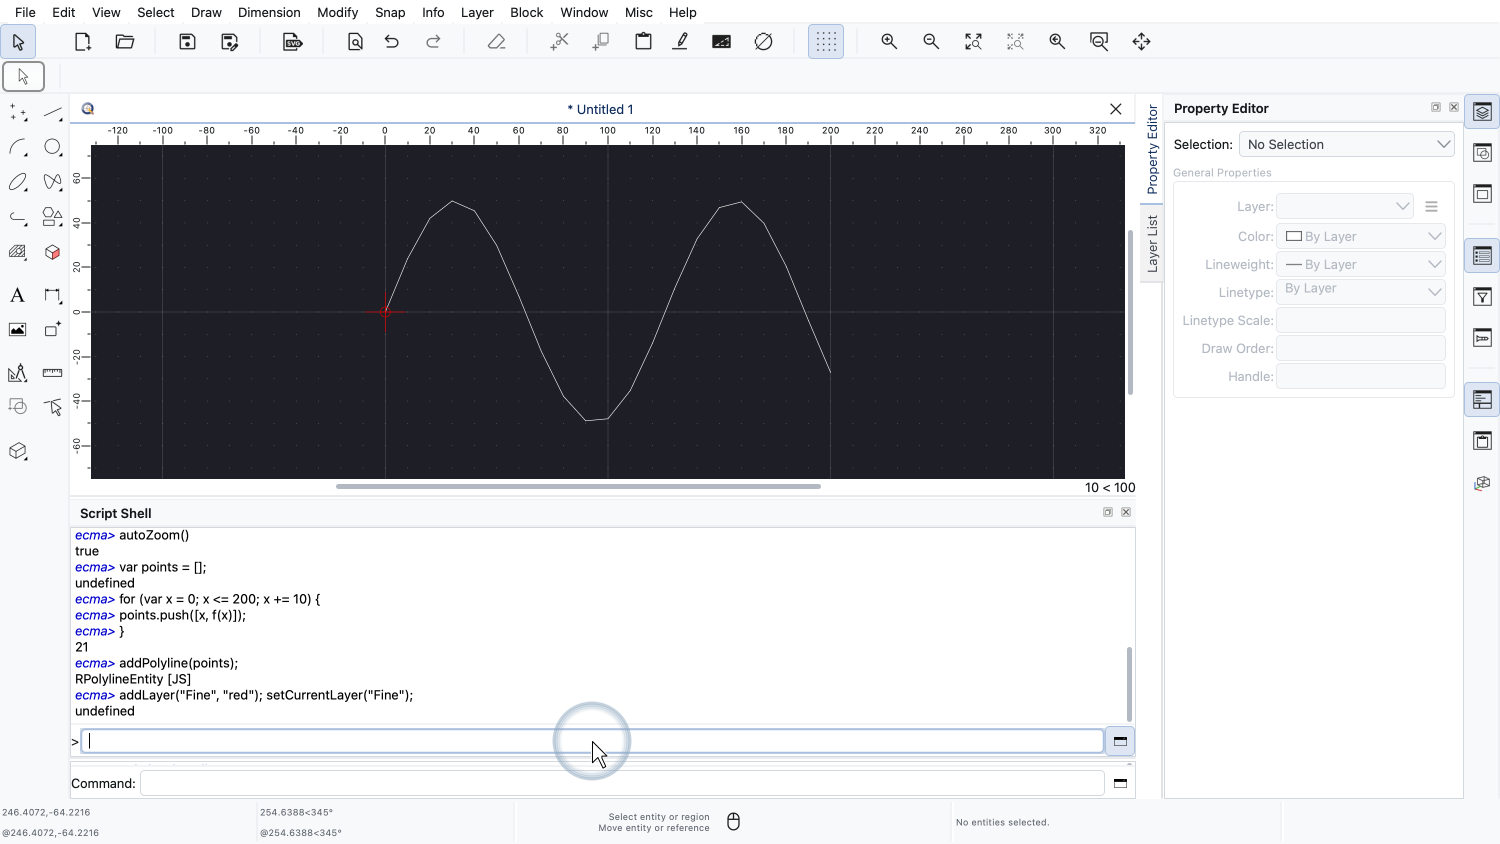
To be able to compare both graphs, we add a new layer with the name Fine and the color red and make it the current layer.
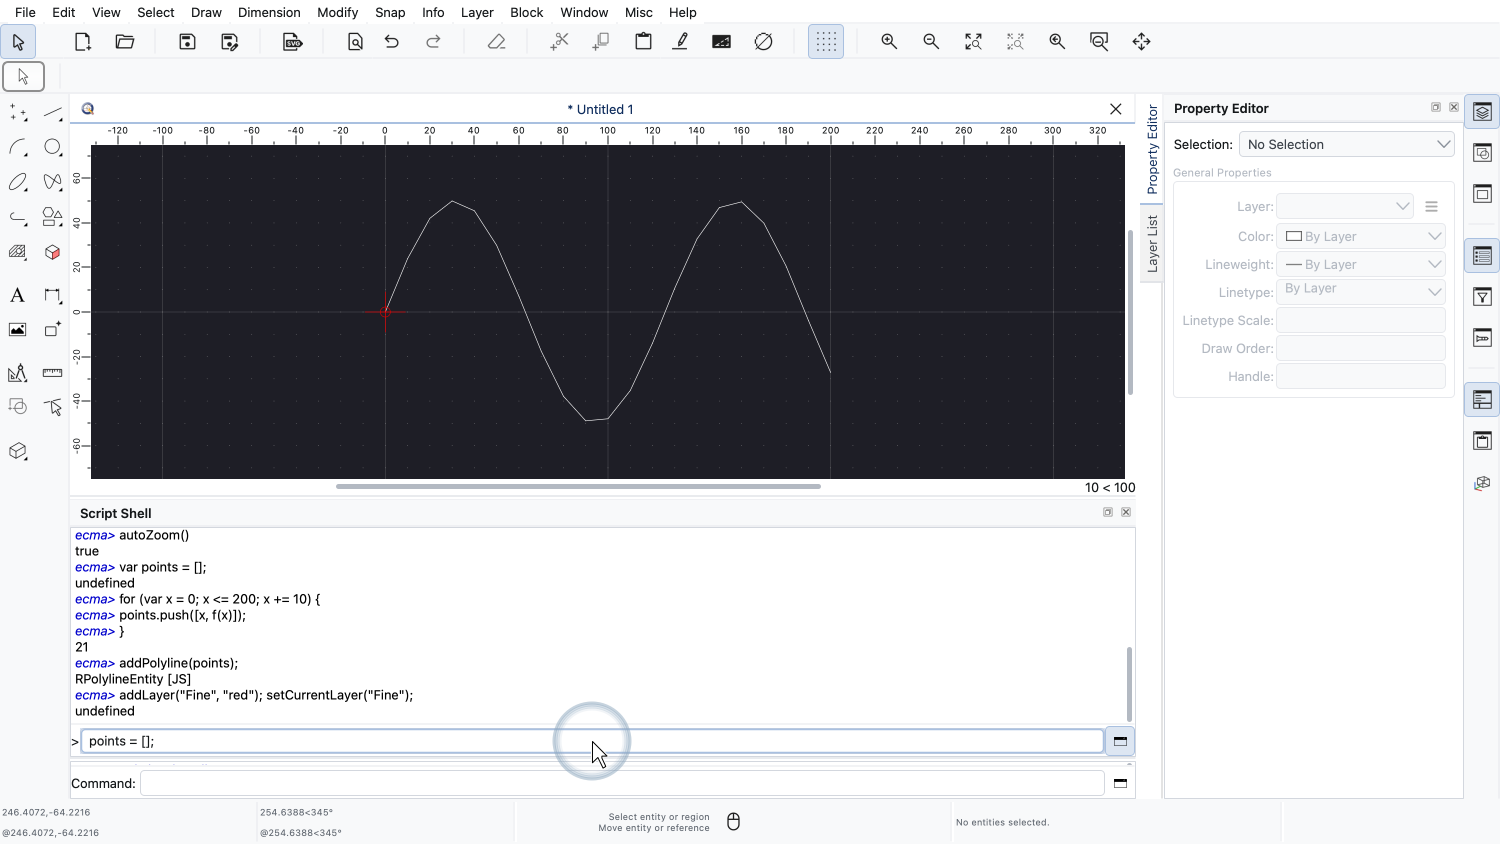
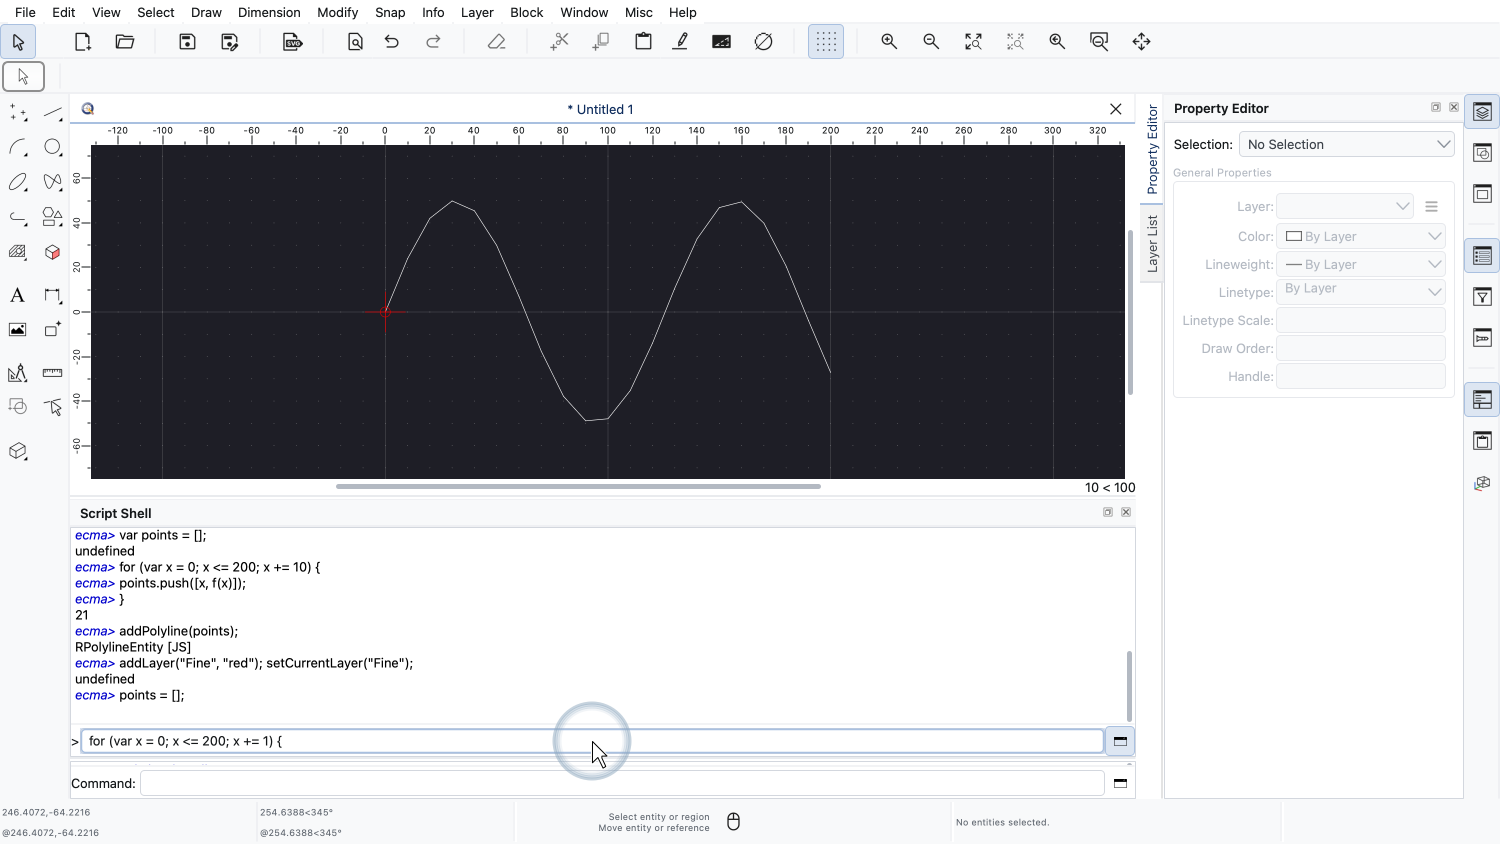
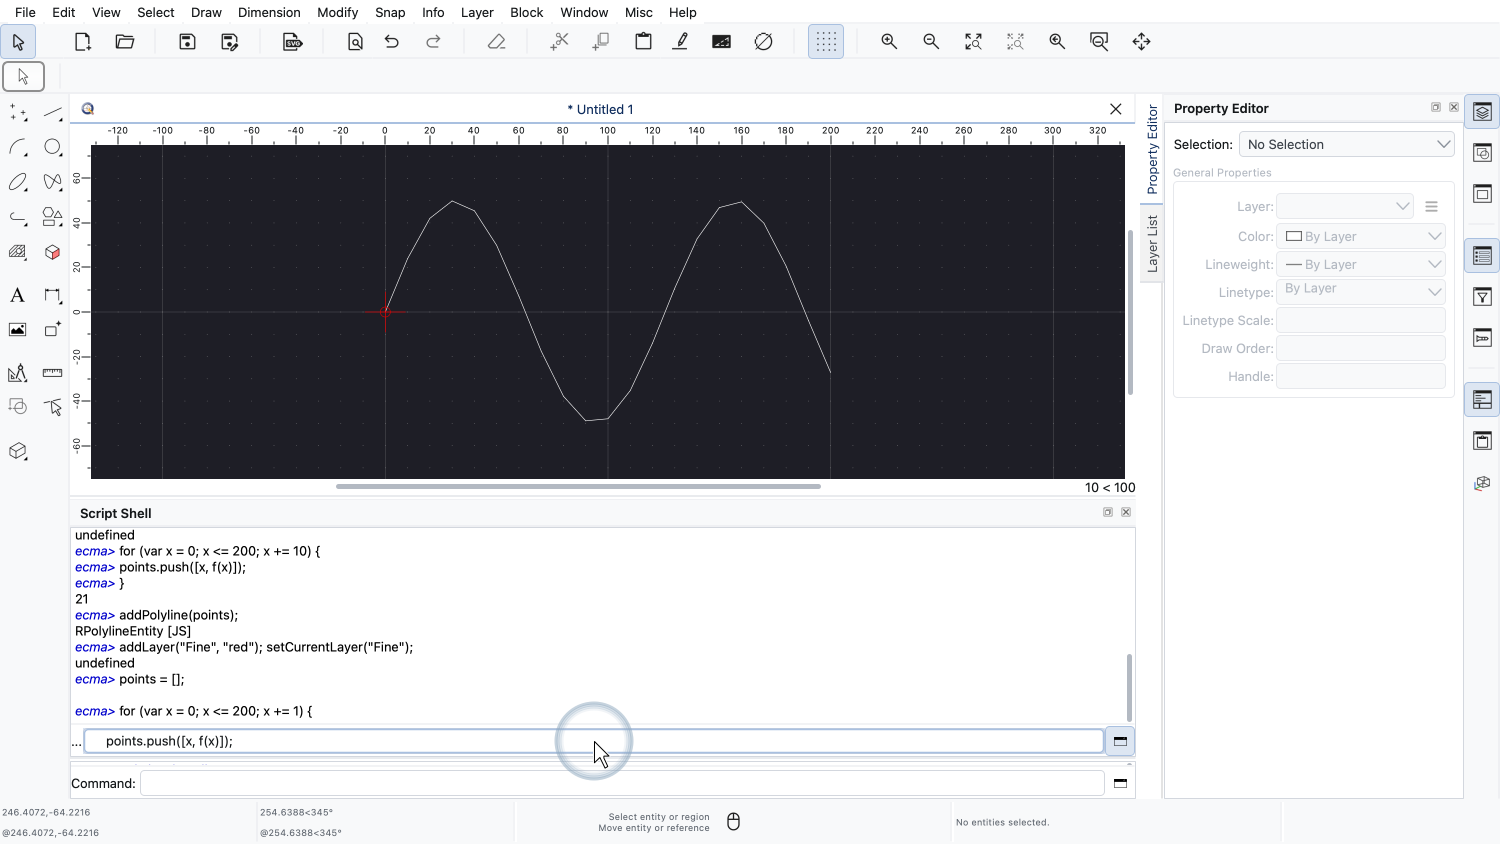
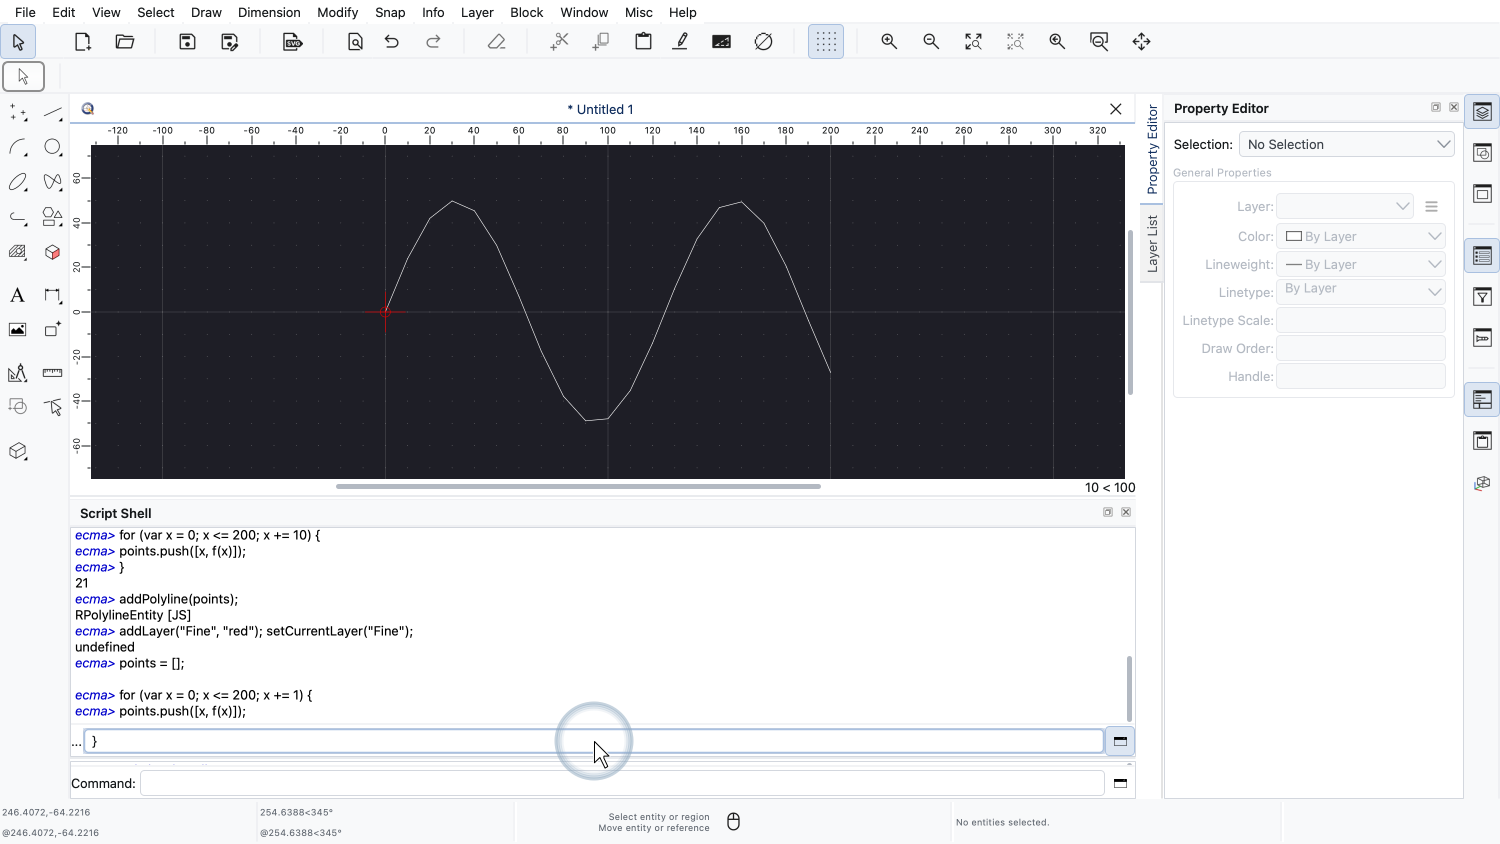
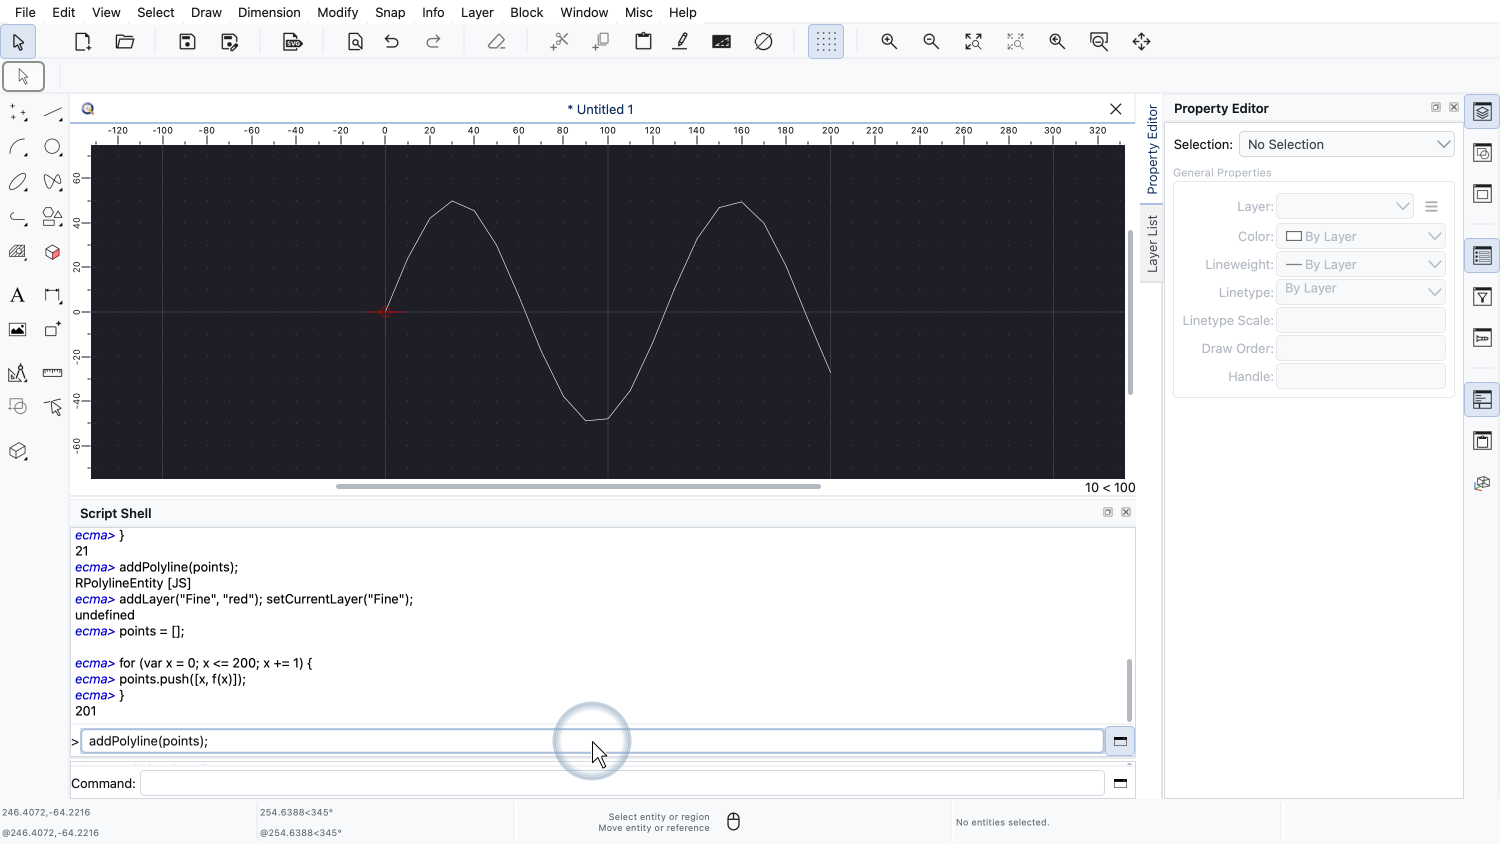
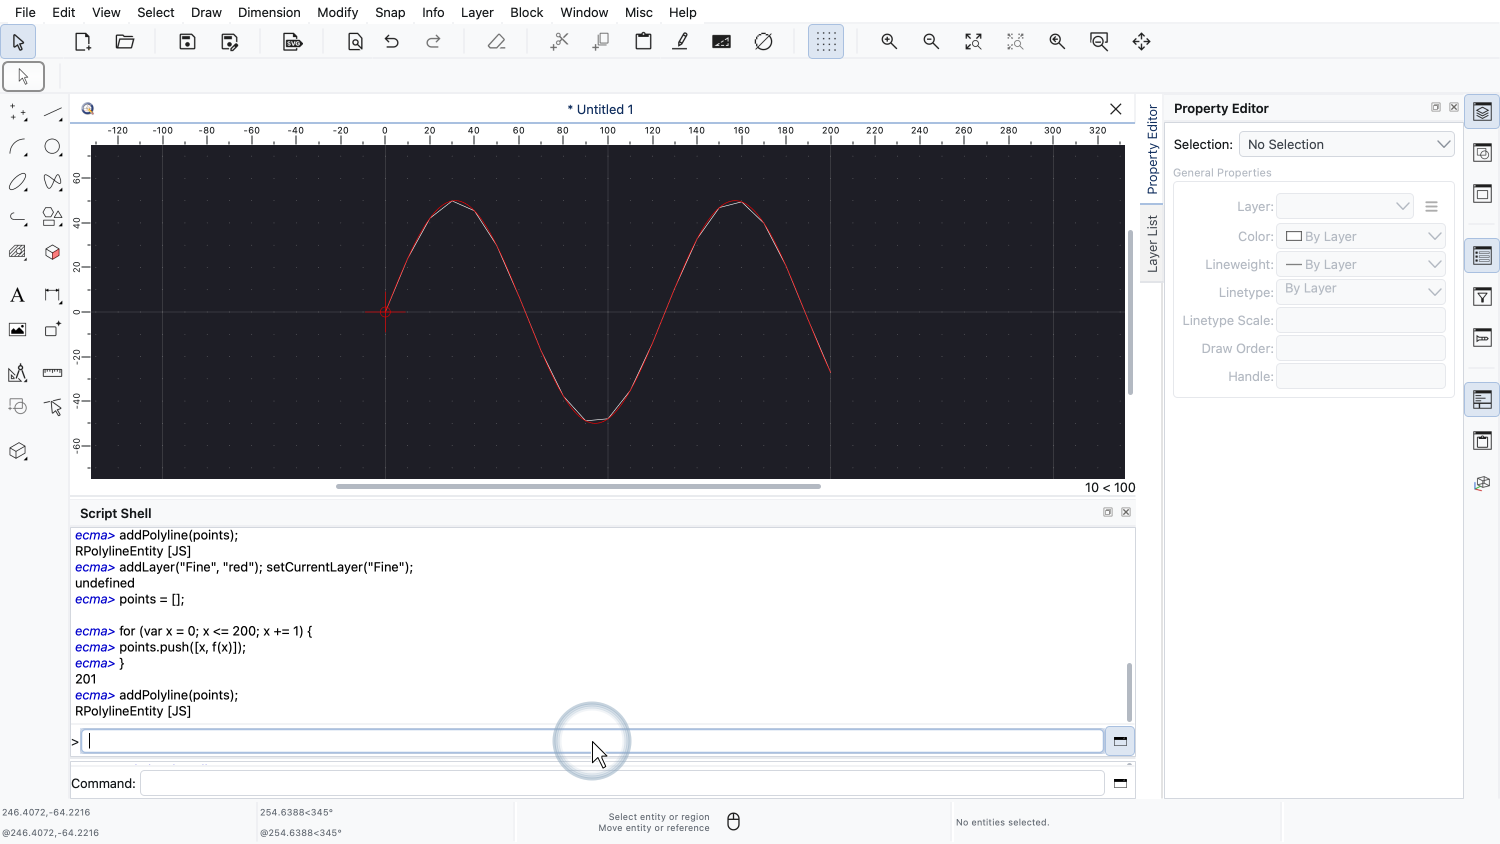
Then we run the same code again, this time with a step of 1 instead of 10.
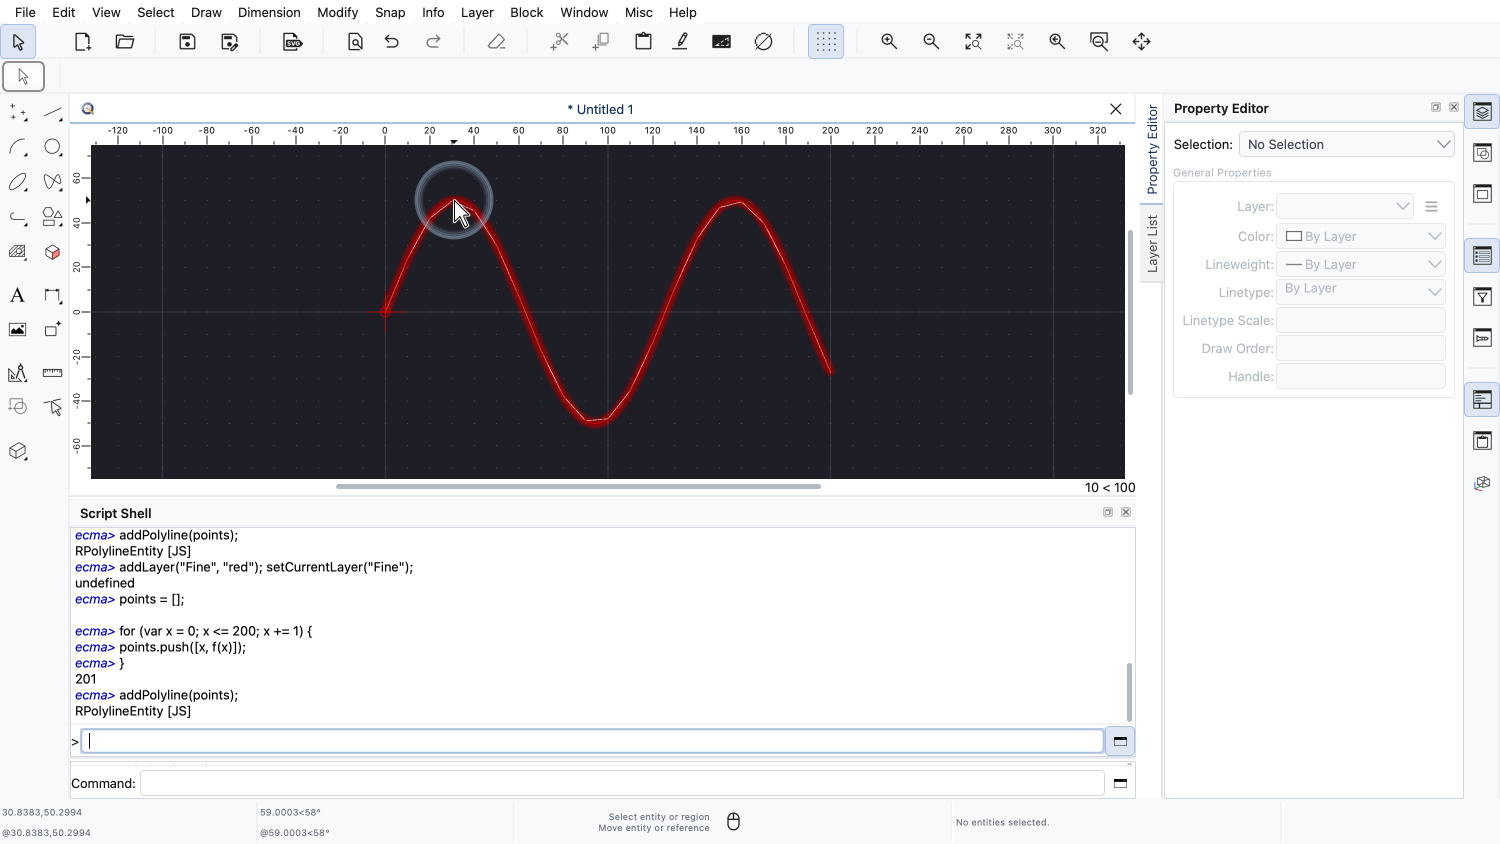
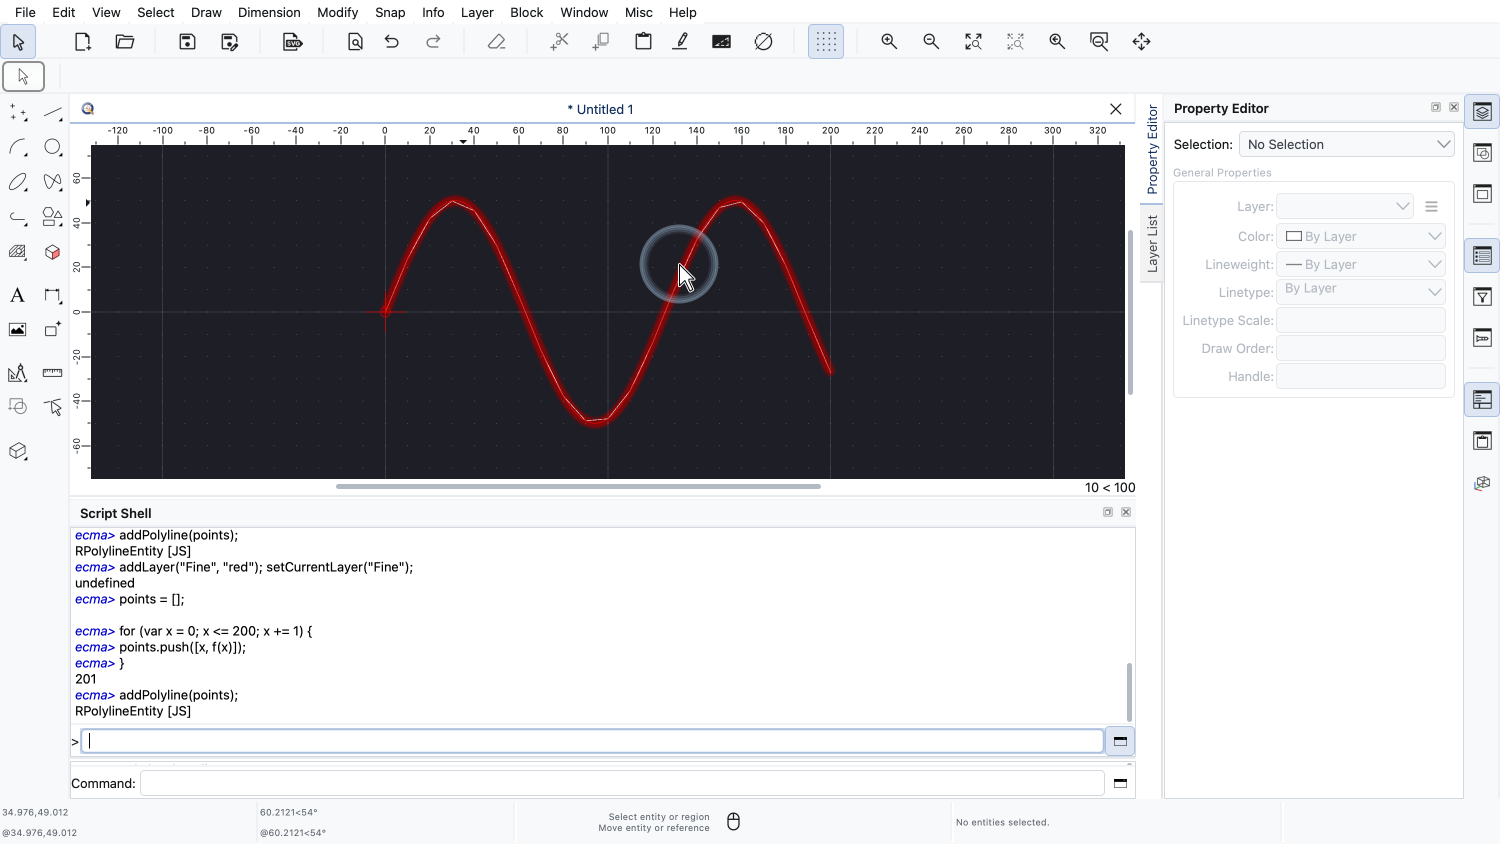
The red polyline with 201 points is a much smoother representation of the function.
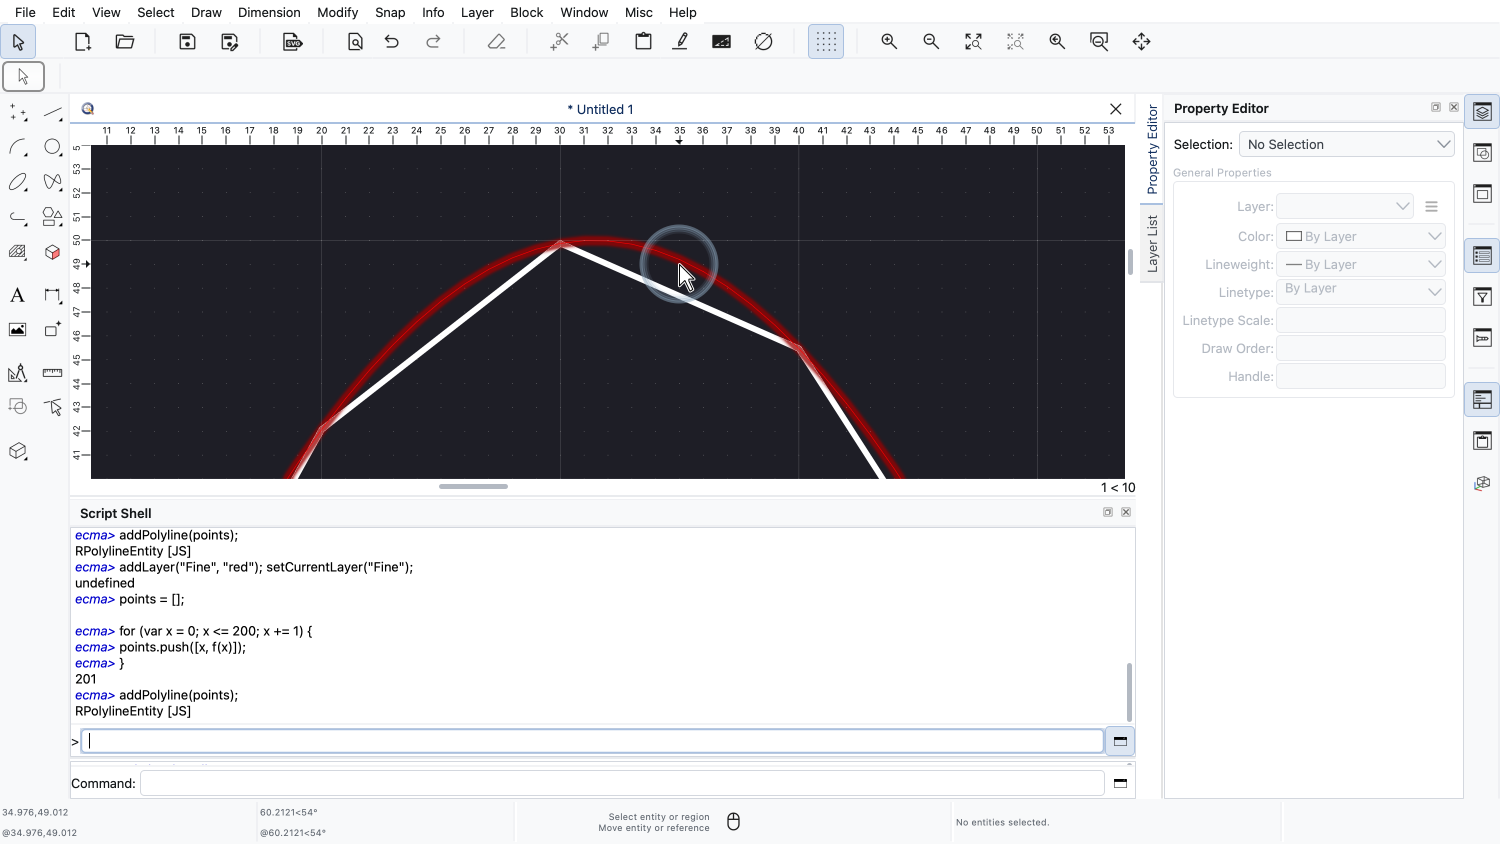
When we zoom in, we can see the difference between the two graphs.
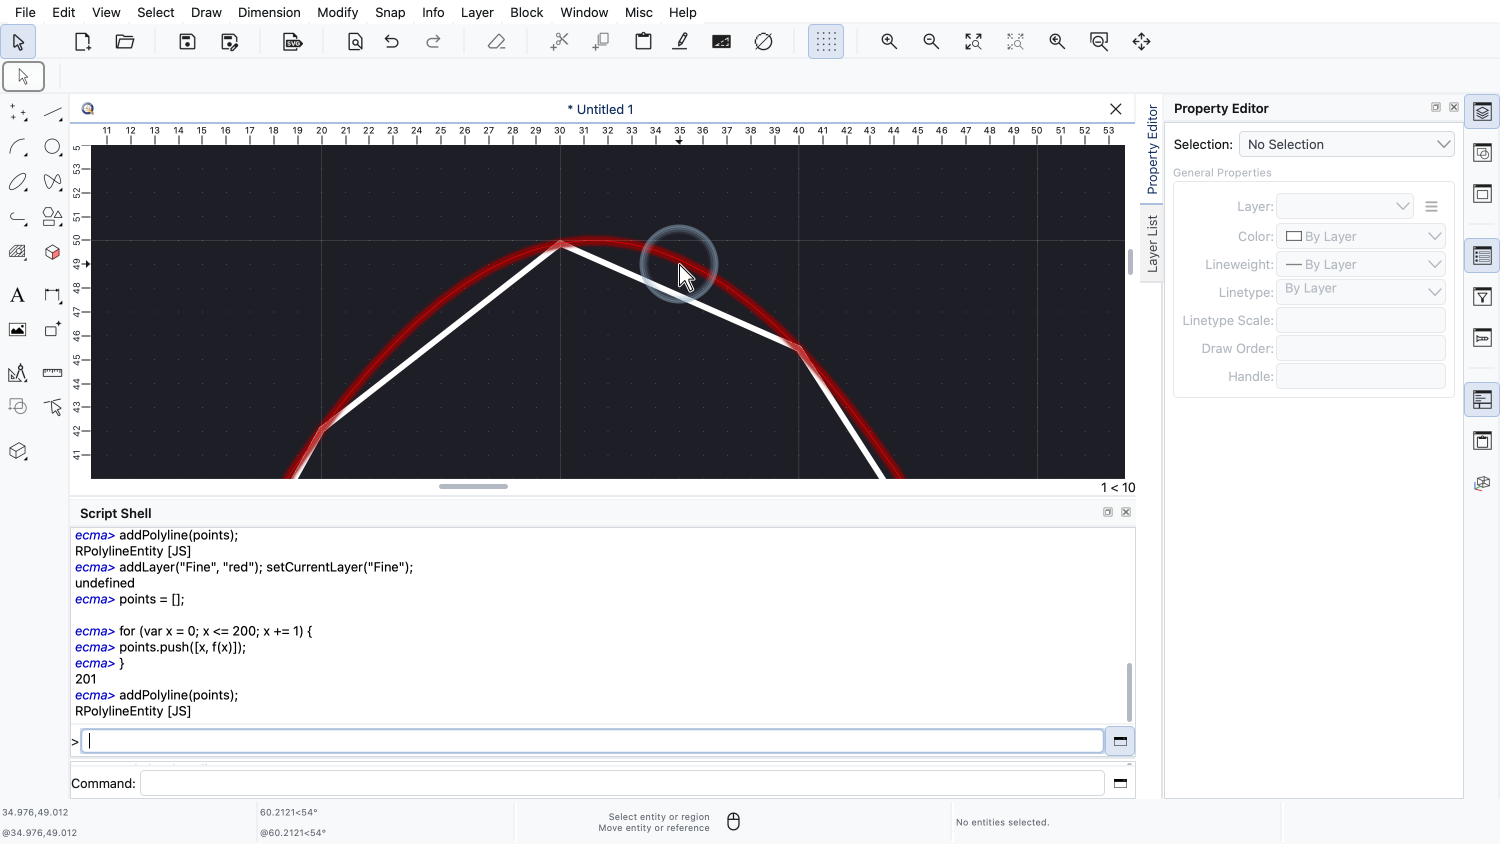
The coarse white polyline cuts the corners, while the fine red polyline follows the function very closely.
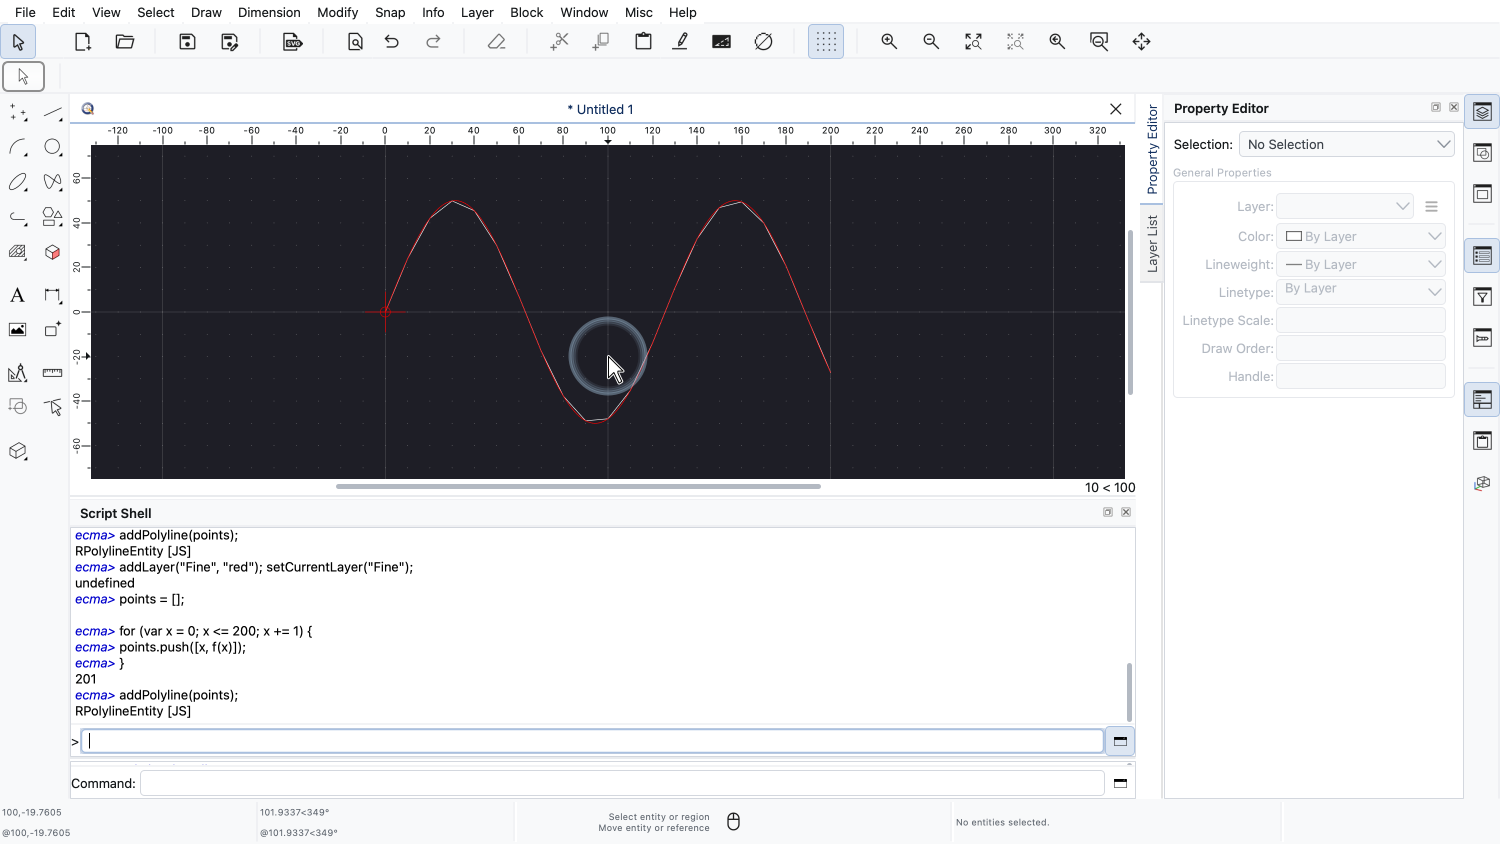
Both graphs are single polylines, which can be moved, scaled or edited like any other polyline in QCAD.
The script shell is ideal for trying things out. Once our code works, we can better save it to a script file and run it with the tool Run Script, in the same Development menu.
You should now know how to use the script shell and the Simple API to create geometry in QCAD with a few lines of JavaScript.
Be sure to practice this with your own QCAD installation.
Thank you for watching this QCAD tutorial.